Tuesday, October 15, 2013

Bubble bubble, toil and trouble


Apologies for distorting Shakespeare’s Macbeth, but recent talk of a housing ‘bubble’ in Australia is increasingly reminiscent of Soothsayers with bubbling cauldrons of economic brew.  While dire warnings of impending doom are taking things too far, there are good reasons to be concerned about housing dysfunction in Australia.

The definition of a market bubble is where prices trade at high volumes and at prices which are detached from intrinsic value. We usually only spot a bubble after the event – when prices drop sharply. Australia’s housing markets may be dysfunctional and structurally distorted by taxes and regulation, but to suggest they are in a ‘bubble’ is a simplistic observation based mainly on some recent positive movements in the established house markets of Sydney and Melbourne. 

One of my main complaints with many economists and much of the media is that they treat Australia’s housing market as a single product, equally subject to the laws of supply and demand. Apart from obvious geographic differences, there are very large differences between the established housing markets (trading of second hand homes in established areas) and new housing development. Few commentators, policy makers or reporters seem to understand the significant impact on input prices for new housing of things like complex planning regulations, the long lead times on new supply, the distortions to supply imposed by urban growth boundaries, the differential tax treatments on new supply through the GST and the per-dwelling infrastructure levies - none of which apply to established housing.

This weight of this regulatory and tax burden has largely been created by various state and local governments from the late 1990s onwards. It’s had a dramatic impact on new housing construction, pushing our rate of new dwelling supply per thousand of population to a thirty year low. Anyone looking at this depressing graph would be hard pressed to be talking about a ‘bubble’ in the Australian housing market:


While new taxes and regulation have succeeded in pushing the new housing market to a 30 year low in terms of new supply, the same can’t be said for the established housing market which has largely been left untouched by regulatory or tax creep for decades. It would be political suicide for a government of any persuasion to tamper with taxes or regulation of existing housing. (Somehow though, the same political caution hasn’t been felt in terms of new housing).

So the performance of the established housing market has been in stark contrast to the new housing market. And it is graphs like this which have ‘bubble’ proponents staring deep into their cauldrons:


The latter shows that established house prices in major centres have risen dramatically, relative to measures of economic growth and to average incomes. Does this constitute a bubble?

Certainly, for people on average incomes, entering the housing market via the established house market, especially in inner city or mid ring areas where supply of vacant land has been all but exhausted, can now be prohibitive.  Supply is constrained because established areas are built out. More people wanting to live in these areas means rising demand relative to supply, and when economic conditions permit (as they do now) prices rise.

With median house prices (based as they are on the sale of established houses) hovering around the $500,000 mark in many cities, you would ideally need a combined household income of $100,000 for this to be anything like affordable. $150,000 would be better. Having said that, there are enough families with two incomes bringing in over $100,000 per annum so that housing at this level is still accessible for some. But if your combined household income is less than $70,000 per annum, you’d be pretty much locked out of many housing opportunities in established areas. And there are also plenty of families and individuals who fit that description today.

So while I don’t see a ‘bubble’ I do see a structural problem which needs to be addressed. And that problem is that where once Australian cities offered a ‘pressure valve’ via low cost, entry level housing on the urban outskirts, the price advantage of this option has now been removed by public policy changes.

The arrival of Urban Growth Boundaries (UGBs) in the late 1990s to early 2000s created an immediate shortage of low cost land for new housing. Market pressure built up within these artificial boundaries and vacant land prices shot up, while lot sizes fell – a double whammy. The GST - which applies only to new housing - added 10% to the cost of a new home, and infrastructure levies compounded the problem, adding in many cases $30,000 to $50,000 per dwelling. Soon enough, we reached the point where between a third and 40% of the cost of a new home could be attributed to new policy initiatives delivered via our planning regulators and Treasuries.

Remember, the actual building cost of detached housing has remained largely unchanged for decades – at around $1000 to $1200 per square metre. But the land cost on which that house sits has skyrocketed, as have taxes on new housing, as has the regulatory compliance cost. So the new house and land option, which was once a low cost pressure valve accessible to young families and low to moderate income groups, quickly became just as expensive as established housing in inner city and middle ring areas. Little wonder the rate of new supply collapsed so quickly.

Look again at the graph above. The market distortion took hold in the early 2000s. It doesn’t matter whose graphs or analysis you use, it was around this time that prices for housing started to move well out of sync with incomes or measures of economic activity. It was also around this time that State Governments were busy extolling the virtues of growth boundaries to ‘contain sprawl’ and plan for ‘sustainable futures.’ It was around this same time that State and Local Governments latched onto the idea of per lot infrastructure levies on new housing as a means of raising revenues. It was around this time that the GST arrived, applying as it did only to new housing. It was a triple whammy effect that has so distorted housing markets that there are virtually no low-cost entry-level options left. The pressure continues to build on existing house prices while the new building market continues to suffer. That pressure isn’t coming from first home buyers, but from people already in the market: upgraders and investors. It’s also coming from overseas buyers, and (worryingly) from geared Self-Managed Super Funds.

Talk of an Australian housing market ‘bubble’ is too simplistic but appeals to media appetites for ‘boom’ and ‘bust’ scenarios. The real story behind Australian housing markets is more complex. For those prepared to invest some time looking into it, the signs of markets distorted by inequitable regulatory and tax measures are immediately apparent, particularly as they apply to new supply.

Thursday, September 19, 2013

Older not wiser

Australia has an ageing society and while living longer is good news for many, there are some major economic issues we need to understand to avert a huge problem in the years to come.

According to a recent UN report, roughly half the children born in developed and developing economies after the year 2000 will live to 100. Australia is no exception to a worldwide trend of increasing life expectancy. We are ranked equal fourth in the world, with a current average life expectancy of 82. The number one spot is shared by Japan, Switzerland and San Marino, where the average is just another 12 months (83 years).

To put this into some perspective, the global average life expectancy in the early 1900s was just 31 years. In early modern Britain (from 1700 to around 1900) is was somewhere between 25 and 40 years. In Classical Rome and Greece, it was 28. Most of you reading this now would have been long dead after 40 if you’d been borne at any time prior to the late 1800s.

But modern diets, standards of healthcare and higher quality of life in developed economies mean that we’re all now living longer, on average. The only problem with this is that we’re still working on a pre-industrial model of employment, with an expectation that we’ll all retire sometime around 60 or 65. So if we’re going to start living on average well past our 80s, that’s going to mean a longer period without an income. For children being born today who might live to 100, that could mean a working career of 40 years, and a retirement period also of 40 years.

Compounding the basic maths of this problem for Australia is the baby boomer ‘bubble’ which has tilted our demography toward the older end of the scale. This means there are fewer and fewer people of working age, paying taxes to run the country, and also (somehow) to support an increasingly geriatric population.

Few of us it seems believe that superannuation is going to come anywhere close to supporting ourselves in retirement. Repeated surveys reported in the media point to a sceptical view of even semi prosperity in retirement. And the high cost of housing could make this all potentially much worse for Australia for two reasons.

First, fast forward 20 or 30 years. Fewer Australians are going to own their own home on retirement. At present, roughly 78% of retirees own their own home at retirement age. This report tips that could plummet to just 2% by 2050.  That could be a touch on the alarmist side but the consensus of these sorts of forecasts tends towards a gloomy view. Rates of ownership are falling and, as policy makers continue to fiddle with failed planning dogma, there’s little prospect of that changing. So at the oldies end of the scale, not only are there going to be many more of us aged over 65 (there were 2.5 million over 65s in Australia in 2002 and this will rise to 6.2 million in 2042) but for the majority of us, we may no longer even own the home we live in by the time we stop working. That’s a pretty fundamental component of today’s retirement planning up in smoke.

Second, at the younger end of the scale, the prohibitively high cost of new entry level housing is seeing more and more young people rent rather than enter the market. I am talking particularly here of new house and land packages on the urban fringe, the supply of which has been artificially restricted under land use policies introduced since the mid 1990s, and the supply of which was also discriminately taxed since around the 2000s (the GST combined with infrastructure levies and other charges apply ONLY to new housing supply).

There’s a growing class of investors who applaud every increase in house prices. But their enthusiasm should not be shared by sensible policy makers because this generation of today’s young people are not only being denied low cost entry level housing, but they will also be expected to pay a disproportionately high burden of tax. That’s because they’ll be among the minority of the population with jobs, supporting the rest of us without them. On top of this, they’re going to live a lot longer. Maybe to 100. So for some of them, their working lives will be spent renting other people’s property, paying higher taxes to fund a disproportionate number of old people, and then somehow fund a 40 year retirement.

It’s not sounding pretty, is it?

To me, this makes it all the more imperative that today’s policy makers understand the primary importance of promoting home ownership for all Australians. As an enforced means of saving, it beats superannuation, it promotes long term wealth generation and continues a long and successful tradition of home ownership for all in a prosperous and egalitarian society, as Australia has been.

That promotion of home ownership should not come through failed grants or financial stimulus to the demand side, but removing barriers and costs from the supply side. The rigid urban growth boundaries and densification policies which became fashionable under a succession of Labor State Governments since the mid 1990s are proven failures and should be abandoned. The discriminatory system of taxing only new supply through both the GST and per dwelling infrastructure levies is highly distortionary and has meant that between one third and 40% of the price of new house and land package can be attributed to taxes introduced only just over a decade ago.

Not only is it distortionary, it doesn’t even work: to the best of my knowledge, these upfront per lot levies account for only around 3% of local government revenues and there’s no way of linking the money raised to the things it’s supposed to be spent on (local infrastructure). Plus, it’s all but killed off the new home building industry, which is now producing fewer dwellings per thousand people than any time in the last 40 years, with the economic signals (unemployment being one) to show for it. Some achievement.


In summary, there’s almost no disputing that we’ll all be living longer, or that there will be more aged people as a proportion of our population than ever before. This can be cause for celebration, but it will also mean that the importance of home ownership as a broad social and economic objective for Australians needs to be returned to a central place in policy thinking, not shunted to the periphery of fashionable planning ideology as it has been.

Wednesday, August 21, 2013

Immigrant nation

Australia’s history is one of immigration. Many came, ironically given the current political debate, by boats. As the debate over illegal immigration swirls, it’s maybe timely to remind ourselves how we all got here in the first place.

Before anyone gets a head of steam up, you shouldn’t take this opinion piece as any sort of endorsement of illegal immigration, nor am I naïve enough to think that being ‘soft’ on the current illegal immigration issue will do anything to solve the human crisis of people drowning at sea. Nor will it deal with the criminals who put them there. But given I technically arrived in this country by boat in 1975 from Hong Kong  (aboard the SS Chittral as I recall, since scrapped), I have something of a personal, as well as historical interest (I studied Australian history at University) in the topic of immigration.

Black fellas

The first immigrants to Australia, ancient history suggests, were what we now call Aboriginal Australians. The evidence appears to say they arrived by boat or maybe by land bridge from what is now called Indonesia. If some walked, they did so because the ice age lowered sea levels to the point this may have been possible but boats seem the most logical explanation. The rising seas after the ice age made the passage more problematic so those who got here before that big melt, stayed largely uninterrupted. That was roughly 50,000 years ago, or maybe 20,000, depending on who you believe. No one was writing much of anything down back then, so we’ll never really know. Safe to say it was a bloody long time ago.

White fellas.

Also arriving by boat came the white fella. The Dutch or Portuguese may have ‘found’ Australia before Cook, but Captain Cook gets the credit for landing here in 1770. The black fellas argue to this day that the white fella arrived ‘illegally’ and took their land. Terra nullis – the idea that Australia was unoccupied – was really a case of “to the victor the spoils.” So along came the white fella, the boats, and the convicts, followed by free settlers. Australia as we know it today with borders and government, was born.

The yella fella.

News of the discovery of gold in the early 1800s in various parts of Australia spread quickly around the world. Border controls, not being what they are now, meant prospectors from all nations were keen to have a crack at the underground loot. Americans, leaving the US gold fields, were among those arriving here in number but nothing like the Chinese immigrants who came in their droves. Gold fields in Victoria, NSW and northern Queensland (around Cooktown) hosted very substantial populations of Chinese immigrants, who mainly weren’t all that welcome. Some of the black fellas ate them (said of some raids around the Cooktown fields) while the white fellas detested their pigtail hair, opium dens and basically just the culture clash posed by the Chinese presence. There were race riots in the late 1800s that made the Cronulla riots of recent history look tame by comparison. But over time Australia started to get used to Chinese laundries and the many other benefits – material and cultural - brought by the Chinese and things started to settle down, at least as far as the Chinese were concerned.

The wogs, dagos, spics and others

World War One denuded Australia of a huge chunk of its working adult male population. We limped through the aftermath, including the depression, only to find ourselves in World War Two. The post war environment was one of rebuilding, and without sufficient labour and with huge volumes of allied European peoples whose lives were basically destroyed by the war looking for a new start, Australia opened its doors. Italians, Greeks (Melbourne is still to this day said to be the second biggest Greek city in the world), Spanish, Egyptians (and including a healthy dose of more Poms) all arrived by boat to help settle and develop post war Australia. The legendary Snowy Mountains scheme owes much to these immigrants. Their customs (including their food) soon found their way into the Australian heart.

The Vietnamese.

Another war, this one in Vietnam, didn’t end so well (do any of them?). Vietnamese people looking to escape the intolerable injustices of the post fall-of-Saigon era, sought escape, and did so in their droves. They also took to boats and for a time, Australia had its first modern era experience of illegal immigration in the late 1970s. One famous illegal ‘boatperson’ (as they were called) is Ahn Do, now a popular comedian and recipient of ‘Young Australian of the Year.’ His book, “The Happiest Refugee” is a must-read account of his early life and struggles through to his love for his adopted country.  Many others also made their lives here and - after some initial race tensions  - largely found their way into the Australian culture, becoming a part of it in the process. Food seems to have a big role in this, and before long, Vietnamese food was overtaking Chinese as the preferred dine in or take away option, and rivalling the pizza brought here by the Italians. Fish and chips was by now a poor third or fourth. Or fifth.

And now the rest.

Wars seem to be followed by waves of people wanting to settle here, and the troubles of the Middle East and Africa are no exception. We’ve already accepted substantial numbers of legal immigrants from troubled African states like Somalia or Nigeria but we’re also prominently in the news now for trying to deal with an illegal trade in people, mainly from Afghanistan or other Indo-Sinai regions. It’s a human tragedy and the solutions are not easy but we are a big country with a long history of immigrants, both legal and illegal, so no doubt it’s something we’ll deal with sensibly and humanely. 

For what it’s worth, it’s my view that the majority of people so desperate to get here today will, just like the waves before them, only make us a better people.

It might, in the midst of this torrid debate we’re now having, be worth thinking about the words inscribed on the Statue of Liberty in New York harbour, past which literally millions of immigrants sailed on their boat laden arrival to the new world:

“Give me your tired, your poor,
Your huddled masses yearning to breathe free,
The wretched refuse of your teeming shore.
Send these, the homeless, tempest-tost to me,
I lift my lamp beside the golden door!”

It didn’t do America any harm. I think ultimately we’ll manage too.

PS: Maybe we already have our own version of the sentiments expressed in the poem inscribed on the base of the Statue of Liberty. They include this:

“We are one, but we are many
And from all the lands on earth we come
We share a dream and sing with one voice:
I am, you are, we are Australian.”

It was written in 1987 by Bruce Woodley of The Seekers and Dobe Newton of The Bushwackers. You can get all patriotic and watch it on line here.  For my money, it ought to be our National Anthem. And no mention of being ‘girt’ by sea either.

Saturday, August 17, 2013

The forgotten people

Sir Robert Menzies wrote his speech ‘the forgotten people’ about middle class Australia in 1942. Much of it remains relevant today, especially for the generation of new housing buyers who seem increasingly disregarded in public policy debates.

It occurred to me recently that with all the various lobby groups and government agencies involved in the planning and delivery of new housing, the needs of the actual homebuyer seems frequently overlooked or plain ignored.

The home builders have the HIA, general builders have the MBA, developers the UDIA, owners and developers the PCA, the planners have the PIA, architects have the AIA and so it goes. Each group lobbies for the interests of its members, not for home buyers. Home buyers themselves are largely without a voice. They are the new ‘forgotten people’ in a debate about government financing requirements, infrastructure deficits and industry capacity to pay.

It’s reached the point that, despite much hand wringing about the housing affordability issue in Australia, government discussion papers and industry responses to them frequently – it seems to me – overlook the end user. Affordability often doesn’t rate a mention. Discussions about infrastructure levies, for example, seem to revolve around government claims that they haven’t sufficient funds to scrap the levies while industry responses seem to revolve around their own financial difficulties posed by the levies.

But a $30,000 levy, for a young couple on a combined $70,000 per annum (for example) is a very significant amount of money. It’s added to the cost of a new home, and they are asked to pay for it, or borrow to pay for it through their mortgage. This inescapable point is so widely overlooked in the many discussion papers that you begin to suspect it’s deliberately not a focus. It would be a difficult position to justify if it was.

Then we had some recent debate about raising the rate of GST. Some industry groups support this. But as GST only applies to new housing (not established or second hand stock) such a move would only widen the gap in tax treatment which is heavily distorted by taxing new supply only. The GST on a new $400,000 home is $40,000. An increase to 15% would raise it to $60,000. A big $20,000 increase for the young home buyers.  Big enough to write off their chances of entering the market with a new home. But unless I’ve missed it, proponents of raising the GST level have not commented on what this would do to new housing.

Ditto the ongoing debates about urban growth boundaries and the regulator’s desire to limit choices for detached housing in favour of higher density models. The debate swirls around issues of planning ideology, environmentalism, and growth ‘management’ (a byword, in my book, for excessive control). Despite clear evidence of the price impacts of growth boundaries on the cost of new land for housing, the proponents simply disregard the financial impact on young home buyers.

In all of this, the hapless generation of new home buyers are without a voice. Many don’t even know that up to 40% of the price of their new dream home where they’d like to start a family can be sheeted home to taxes introduced in just over a decade. They wouldn’t even know that someone could buy a multi million dollar established home in an upmarket area and pay less tax than they are being asked to.

But onwards we plough, disregarding the irrevocable damage we are doing to society by reducing a generation’s ability to buy and own their own home. The social and economic consequences of a generation of renters in their old age is something, it seems, we can all worry about in years to come. After this election certainly. And after the next one too probably. Let’s wait until it’s too late.

There is no home buyers party at the coming federal election. Housing has barely rated a mention (Sydneysiders with existing stakes in the market, for example, are happy watching prices rise so why make it an issue?) But we have Katters and Greens and Palmers and a host of other minor parties, and the major parties also, and none of them, so far, seem to acknowledge the magnitude of this problem let alone are they ready to articulate meaningful and workable reforms that can actually make a difference for the forgotten people in this debate.

Menzies had it right when he said:

“I do not believe that the real life of this nation is to be found either in great luxury hotels and the petty gossip of so-called fashionable suburbs, or in the officialdom of the organised masses. It is to be found in the homes of people who are nameless and unadvertised, and who, whatever their individual religious conviction or dogma, see in their children their greatest contribution to the immortality of their race. The home is the foundation of sanity and sobriety; it is the indispensable condition of continuity; its health determines the health of society as a whole.

I have mentioned homes material, homes human and homes spiritual. Let me take them in order. What do I mean by "homes material"?

The material home represents the concrete expression of the habits of frugality and saving "for a home of our own." Your advanced socialist may rave against private property even while he acquires it; but one of the best instincts in us is that which induces us to have one little piece of earth with a house and a garden which is ours; to which we can withdraw, in which we can be among our friends, into which no stranger may come against our will. If you consider it, you will see that if, as in the old saying, "the Englishman's home is his castle", it is this very fact that leads on to the conclusion that he who seeks to violate that law by violating the soil of England must be repelled and defeated.

National patriotism, in other words, inevitably springs from the instinct to defend and preserve our own homes.”

Where is that patriotism now?

Thursday, July 25, 2013

Why infrastructure levies are hard to justify

Upfront per lot infrastructure levies, in addition to raising the price of new housing (and hence dampening demand) are also highly discriminatory. They apply only to new houses or apartments and effectively transfer a community wide infrastructure burden onto the mortgages of new home buyers. This approach is hard to justify on social fairness grounds.

One way to highlight the manifestly unfair discrimination of per lot infrastructure levies is to contrast the cost impact on a young low to middle income family buying their new home, with a wealthy family buying an established multi-million dollar home.

If you thought the millionaires would pay more, you’d be wrong. Yes, the way levies are now applied means that the young family will pay more tax on their new home in absolute dollar terms, and in percentage terms, than millionaires. Little wonder the new home building market is at generational record lows, and little wonder new home buyers have been on strike.

Here’s a simple illustration.

Alan and Kylie have finally scraped together their deposit monies for a new project home (or it could be an apartment) and got their bank approval. The purchase price is $450,000. Built into that purchase price is GST (10%) plus a $30,000 infrastructure levy. Add in the additional compliance costs, application fees and related government costs and the total tax and charges figure reaches the $120,000 mark. That’s a conservative number.  Other estimates put it higher.

So Alan and Kylie, possibly on a combined income of around $70,000 per annum, are paying upfront a $120,000 tax bill on their new home.  That’s money they’ll have to borrow. Even at today’s low interest rates that’s an extra $848 per month they’ll have to find just to pay the upfront tax bill (calculated on the basis of the extra $120,000 borrowed at 7% over 25 years).  With that extra mortgage burden, they’re deferring having children until later in life.  They’re deferring a lot of things actually. If this is their first home, they are exempt from stamp duty and can get a $15,000 grant (in Queensland anyway). But this grant and exemption combined, however well intentioned, does little to offset the discriminatory tax regime which their new home is subject to.

Now let’s contrast this young couple with another couple. Let’s call this couple Will and Kate, who are buying an established home in an established inner city suburb. They’re on a high household income (Will’s income alone is enough to support a big mortgage plus private school fees for their tribe) and want to live close to the CBD for Will’s job and so their kids can get to the best schools. They’re forking out $1.5 million. They’ll be up for stamp duty, which is $59,600. And that’s about it in terms of property taxes.

Will and Kate’s home also comes with all the handy neighbourhood infrastructure they could want, already in place. There’s taxpayer subsidised rail, buses, libraries and they’re close to action of the CBD’s cultural and recreational attractions. They’ve paid their stamp duty and will only need to pay rates going forward.

So our first young couple Alan and Kylie have kicked the tin for around $120,000 in taxes on their new home. Even netting off the grant for buying a new build, they’re still up for around $100,000 on a $450,000 home.  Let’s call it 25% for simplicity.

Will and Kate by contrast have only had to fork out a touch under $60,000, or around 4%.

Now don’t for a minute take this as some sort of excuse to impose even higher taxes on established homes. Taxes on housing are already too high and we have an affordability problem as it is which is locking out a generation from home ownership. Increasing housing taxes further would be disastrous.

The better and fairer way is to scrap the upfront tax burden on new supply, stimulate demand and produce more lower taxed supply. Spreading the infrastructure burden across the entire community makes sense because the entire community benefits.

However you look at it, the impact of the current infrastructure levies approach on young families buying new homes is very hard to justify. I'd challenge anyone to try do so.


Footnote: Yes, there’s a first home buyer grant, but as it applies equally to new builds and second hand (established) homes, it’s left out of this for obvious reasons.

Monday, July 22, 2013

Infrastructure levies should go.

It’s an axiom of economics 101 that to decrease demand for something, you increase its price. The advent of upfront, per-dwelling infrastructure levies in the early 2000s had a direct price impact on new housing, as did the GST, along with a range of other additional ‘innovations’ in regulatory compliance, fees and charges introduced at roughly the same time. The result? Demand for new housing is now at generational lows.  That’s a high distinction for basic economic theory but an epic fail for public policy.

Depending on whose research you want to rely on, we now have the situation in Australia where between a third and 40% of the price of a new home can be attributed to taxes, fees, charges, levies and other regulatory compliance costs. In the main, these were all introduced in a period of planning ‘reform’ from around 2000 which also introduced urban growth boundaries and increased micro-management of the planning and development process. 

Former NSW Labor Premier (and now Australia’s Foreign Minister) Bob Carr was an advocate, famously declaring in the 1990s that ‘Sydney is full.’ He then presided over a planning and regulatory framework which taxed and stifled development to the point that the risk of growth in Sydney was reversed, and new housing went into a long slump.

In the Australian spirit of poor public policy spreading faster than good, urban growth boundaries and a more punitive approach to development quickly took root in other states. Upfront development levies, which replaced more reasonable headworks charges, were among these policy innovations. They were championed by states and local governments on the basis that new development had to provide for a wider infrastructure burden than an immediate connection to services. Developers, widely attacked as ‘greedy’ by governments, should - the argument went - pay for widespread community infrastructure and upfront levies were a means to this end.

For evidence on just how problematic this became, have a look at this depressing summary.

These per lot housing levies rose quickly to anywhere from $30,000 to $50,000 per lot, without any economic, mathematical or rational justification – beyond ‘developers can afford to pay.’ Combined with the GST (which only applies to new housing not the sale of established housing), it wasn’t hard to find $70,000 in new taxes applied to a $450,000 house and land package, or new home unit. These taxes, it must be remembered, pretty much all arrived in the post 2000 period. And it’s the post 2000 period that’s seen new supply fall to such chronically low levels.


In some jurisdictions, these levies are now being re-assessed. There is recognition that they have damaged the market for new housing and the industry with it. There is some recognition that they are making new housing needlessly expensive. But there is little evidence of a willingness to decouple governments’ appetite for tax revenue from an industry – and new home buyers – that are already very heavily and discriminately taxed.

More alarming is that the very governments (mainly local) who claim they cannot live without these levies, cannot (or will not) identify how much revenue they generate. They do not appear as line items in most local government budgets (itself odd, given how they are allegedly so critical to funding local government infrastructure needs). Neither is there any obvious connection drawn between the quantum of funds now being raised through these levies, and where or on what they are being applied. In the main it seems as though the levies are absorbed into general revenue, and spent on general commitments, infrastructure or otherwise.

I’ve queried industry bodies and searched various local authority budgets for information on these “critical” revenue sources, to little avail. Do they raise 1% of revenue? Is it 5%? 10%? More? I’ve been told that many councils don’t even know themselves.

The question therefore begs itself: if a source of revenue is so clearly damaging to the new housing sector and so clearly having an adverse impact on affordability, it should at least be able to justify itself. Plus, it should be able to demonstrate there is no alternative or at least allow the community the opportunity to weigh the benefits against the costs.

Governments cannot tell us what percentage of rates revenues rely on these levies. If we asked the question “by what amount would general rates for all ratepayers need to rise to offset abolition of per lot levies on new housing?” we would be told “we don’t know.”

There’s an unverified figure I’ve heard that the number is roughly $150 per annum. If true, upfront, per-lot housing levies on new houses or apartments could be abolished provided the general rates base were prepared to accept an additional $150 per annum in rates. That might be unpopular, but we can’t even have that discussion because it seems no one knows.

But if that $150 meant a circuit breaker for the housing industry, if it meant that young families would find housing more affordable, and if it meant that new home buyers would no longer be carrying a disproportionate burden in funding expenditure commitments which benefit all ratepayers generally, maybe it should happen?

At the very least, any government which wants to argue the necessity of a tax which is so clearly damaging to home ownership and housing affordability and which is so demonstrably inequitable, ought at least be able to tell us how much revenue it’s collecting from it. It could be that the revenue collected given the damage being caused simply isn’t worth it.


*Footnote: since penning this article, I’ve seen some data from Gold Coast City Council. In that jurisdiction, developer contributions constitute a paltry 3% of revenue. 

Thursday, June 27, 2013

A suburban economic future?

The last four articles in this series on ‘the demography of employment’ have focussed on the evidence around suburban employment in our major metropolitan areas. This final in the series brings this together and poses a few thoughts about where it may all lead.

Without revisiting all the research in the last four articles, the basics about economic life of our metropolitan regions are that most of the jobs are in suburban locations. In part one, we reviewed how our CBDs – prominent though they are – account for only around 10% of all metro wide jobs. That rises to maybe 15% if you include inner city areas. But still, 85% of everyone else who calls Brisbane, Sydney or Melbourne home, works somewhere other than the CBD or inner city.

Not only that, but the proportion of jobs in the suburbs versus the city has been rising, marginally. This doesn’t mean that CBD job markets are shrinking (in the main, they’re not) just that suburban employment markets are growing faster. So CBDs are becoming, perhaps inexorably, less dominant.

In part two, the evidence also showed that suburban employment isn’t distributed evenly but in various concentrations. Some of these areas add to very large numbers – rivalling the totals found in CBDs – but they do so at much lower densities of employment. Concentrations of 2000 to 4000 jobs per square kilometre are dense by suburban standards but still only a fraction of CBD concentrations. For many suburban employment areas, concentrations are even lower at maybe 500 to 1000 jobs per square kilometre. While CBD office workers measure their space in square metres (roughly 15 to 20 per person) some suburban workers might measure theirs in hectares.

In part three, we looked at the income profiles of CBD and suburban workers. Across the three major centres of Brisbane, Sydney and Melbourne, the research shows that suburban workers, on average, earn considerably less than CBD workers earn. The top ten income areas city wide are nearly all inner city areas, and these workers earn more than double the average of the bottom 10 areas (which are invariably suburban). The average CBD worker, according to the census, pockets between $80,000 and $90,000 per annum. The average suburban worker pockets around $50,000 per annum. Given that suburban jobs account for around 85% of all jobs, the CBD is indeed a privileged centre of income earning ability. Having said that, there are still interesting pockets of suburban employment where above average incomes are to be found. The Brisbane airport and port region, for example, features in the top 10 income earning locations along with inner city locations, even though the majority of jobs (62% to 74% according to the Census) are blue collar.

And in part four, we looked at how work locations drive transit choice. For suburban workers, the private car is the overwhelming mode of transport (above 80% to 90%), not by choice or because of some ‘love affair’ with the car, but of necessity. The very nature of dispersed suburban employment makes public transport uneconomic, which is why only around 5% of suburban workers use it. For CBD workers though, public transport is more widely used because it’s more available and convenient: more than 50% (and more than 60% in Sydney’s case) of CBD workers make use of it. The evidence also shows that the closer you live to the city, the more likely you are to use public transport to get to your CBD workplace. The proportion of people with CBD jobs falls the further you live from the CBD: meaning outer suburban residents are highly unlikely to have CBD jobs and hence only around 3% to 5% use public transport. Ironically, given CBD jobs earn the highest incomes and are also more likely to use public transport to get to work, we have a situation where those with the highest paying jobs are enjoying the biggest benefit of publicly subsidised (and heavily subsidised) public transport. You could argue on this evidence that those on lower suburban incomes are subsiding the train and bus fares of their higher paid CBD workforce cousins.

Now for the future

The evidence is one thing but where it all leads can provoke any number of alternative scenarios. Just for the sake of discussion, here’s one possibility: that cost and convenience factors will increasingly work against CBDs and inner cities and more and more businesses will establish, grow, or relocate to, suburban employment locations.

It’s possible this shift is already underway. The evidence shows a slow diminution of CBD prominence. Technology is increasingly reducing the person to person immediacy and co-location advantages of a highly concentrated CBD environment. We communicate more and more through electronic means, which also means physical location is less and less essential to daily business contact.

Costs are another factor. CBD offices and retail space are expensive relative to suburban locations. They are worth it in terms of prestige where this matters, or where central location is important. But as costs via rents rise, the equation is constantly recalculated. Is it worth headquartering large numbers of staff in CBD offices when these staff have limited need for face to face business dealings outside the business? The cost/benefit analysis is an ongoing exercise and the business press contains plenty of evidence of companies who increasingly decide the suburban alternative is attractive. Rising car parking costs – for business visitors and clients along with staff - are just another factor in the falling competitive advantage for CBDs.

Employee costs could also be a factor. Even basic administrative roles in CBD locations command higher pay packets than similar roles in suburban locations, for whatever reason. If it is possible for administrative functions to be located in a suburban location where total employee costs are less, will this become a factor in the trade-off between CBD and alternative suburban locations?

Congestion may be another. As urban densities rise, especially around CBDs and inner city areas, congestion of all forms (private and public transport) will increase. Density is after all almost a synonym for congestion. Will businesses in increasingly congested CBD or inner city environments opt for suburban alternatives where congestion is less of an issue? It’s a moot point.

On the other hand, because CBDs and inner cities feature such a concentration of social amenity through public infrastructure (entertainment, cultural and recreational facilities) they may continue to appeal as residential addresses. Is it possible that as CBDs and inner cities develop their residential stock, we may find significant numbers of people who live in CBD locations for the inner city amenity, but who work in suburban locations? Time will tell.

Planning schemes would have to adapt to any of the above scenarios. Existing suburban economic areas may need their development density permission under city plans increased to meet demand. It may make sense to do so, especially around transit nodes. TODs may become places where people travel to a suburban workplace centred on a train station or bus interchange, as opposed the current thinking which is that people will live near suburban transit nodes in order to work in inner city locations.

Any number of other scenarios are possible and all this series has attempted to do is present the statistical evidence on the suburban nature of employment in our metropolitan regions, and make some observations about the public policy and future development implications. No one can predict the future but it can be fun just thinking about what might happen. Your guess is as good as mine.

Thanks for the statistical evidence relied on in this series must go to Urban Economics – a great little consultancy whose name says it all. If this series has raised questions in your mind that you want answered, I suggest you get in touch with them. Please contact Kerriane Bonwick via kerrianne@urbaneconomics.com.au or phone them on (07) 3839 1400 if that’s the case.


Wednesday, May 29, 2013

The demography of employment part 4: the commute.

Parts one to three of this series looked at the spatial distribution of work in our major metropolitan centres, and the income profiles of employment based on geography. The findings, simply put, are that between 8 and 9 out of ten of all metropolitan region jobs are in suburban locations (not CBDs). This tends to be widely dispersed at densities up to around 500 jobs per square kilometre, rising to over 2,000 and 3,000 per square kilometre and more in some areas. While the suburbs represent the overwhelming majority of jobs, they also tend to be lower paid than the jobs found in CBDs and inner city areas which can earn on average between 50% and 100% more than suburban jobs. So while the CBDs and inner cities are minority employers, they are employment locations of relative financial privilege, concentrated in small geographic areas.

This instalment looks at how the demography of employment influences the commute. I am again indebted to Urban Economics for their research assistance in pulling these figures together. There aren’t too many questions this company can’t answer, so if these articles raise any particular questions in your mind, please contact Kerriane Bonwick on kerrianne@urbaneconomics.com.au or phone them on (07) 3839 1400.

The top 10 locations Australia wide for public transport commutes to work are all CBD and inner city locations. Topping the list is the Sydney CBD, Haymarket and the Rocks, with 67.7% of workers there using public transport. Next are workers in the Melbourne CBD, with 57.8% using public transport, followed by workers in Brisbane CBD, with 56.1% of workers there using public transport.

Reading on through the top 10 reads like a list of some of the more privileged or rapidly gentrifying workplace locations in the country: North Sydney/Lavendar Bay (52.6%), Surry Hills (49.2%), Docklands Melbourne (47.9%), East Melbourne (41.3%), Pyrmont-Ultimo (40.6%), Perth City (39.6%) and Redfern-Chippendale (37.2%).

The top 25 employment locations for public transport use paint a similar picture (click on the table to enlarge):


By and large, these are all mainly inner city locations. While the proportions making use of public transport to work in these areas is high, the same areas represent only a minority of 10% to 15% of metropolitan wide jobs. Plus, these are jobs which earn, on average, a great deal more than suburban employment. In short, the highest rates of public transport use are found amongst the minority of workers who earn the most money.

The converse is also true. Suburban employment centres, where the vast majority of jobs are located, are reliant on private vehicle. Here’s a selection: North Parramatta – 10% by public transport, 74% by private vehicle; Carindale (Brisbane) – 9.6% by public transport, 60.4% by private vehicle; Maribyrnong (Melbourne) – 8.5% by public transport, 68% by private vehicle. These are typically locations where public transport options are limited: it’s simply too expensive to contemplate servicing lower density suburban employment this way. Workers with jobs in these locations are not choosing the private car, they are relying on it. It’s not a ‘love affair’ but a necessity.

Visually, the picture is stark. The illustration below (taken from a site called ‘Charting Transport’ which is full of useful analysis – this particular illustration is from this article) shows clearly that public transport is typically a mode of choice for CBD and inner city workers and almost of no use to workers in middle or outer suburbs.


It’s the same pattern repeated across other metropolitan regions. The parts in red or orange are where the majority of workers are, the parts in green where a minority of higher paid workers are.

This point doesn’t need labouring but the implications take some explaining. Public transport systems are heavily subsidised by taxpayers. Yet the highest patronage is amongst the minority of workers who earn the most money. Private transport receives no such subsidy and, as motoring bodies point out, it raises more money through registration fees and fuel taxes than is spent on it. Private transport –namely the car – is the only practical mode of choice for the majority of workers in suburban economies, where they tend to earn less. The reality is that suburban workers on lower incomes with limited access to public transport as an option are subsidising the public transport systems used by inner city workers on higher incomes.

The irony is that governments are under almost relentless pressure to spend more taxpayer dollars on improvements to public transport for the benefit of a higher income minority, and also to keep fares low (and hence maintain or even increase the level of subsidies). The level of policy support for taxpayer funded improvements to metropolitan road networks hasn’t been as generous, with extensions and improvements to metropolitan road systems largely approved on the basis of PPPs where investors believe they can mount a business case (with mixed results).  This is despite the reality that the majority of employment is in suburban locations and that arguably private transport users already pay more in taxes than the road network receives in spending.

Australia is not unique in this regard. Many western economies adopt similar subsidy arrangements. (Many eastern economies have such vastly different levels of population and population density that comparisons aren’t really meaningful). But what is missing in Australia seems to be an awareness of how this subsidy plays out. Public transport users with high paying jobs in inner cities are often the first to complain about incremental increases in fare costs. Private car users with lower paying jobs in suburban locations where public transport is simply not an option, are asked to shoulder rising fuel prices, fuel taxes, registration fees – and even, lately, parking costs in some suburban shopping centres – without much public policy sympathy.

None of this should be taken as a pejorative attack on public transport. This is simply the reality of how people across our metropolitan areas commute to work, and the costs – taxpayer and private funded – involved in making this happen. No one, me included, is seriously proposing a divestment in public transport systems in favour of private. The public transport network is an essential element of our transport system. Without it, our urban workforce mobility collapses. Witness any number of occasions when train or bus networks fail, for whatever reason. Plus, public transport has an important social function by providing low cost transport for work and non-work trips for financially disadvantaged members of society who don’t have access to a private care, elements of our aged population, and for students.

But given the way employment is distributed through our metropolitan areas, is it sensible to suggest that spending even more taxpayer money on public transport is capable of making much difference, without also dealing with the realities of where the jobs are? This will tell us more about the realities of how much of the work related commute can be provided for by public versus private transport. We need to understand the economic and geographic realities better, and hope that the media, the community at large and transport policy groups base their arguments closer to the existing and future patterns of employment distribution.

For example, proposals to increase public transport patronage by imposing congestion charging regimes to punish suburban car commuters are, based on the evidence, entirely doomed to fail. Only a minority of the metropolitan workforce can realistically make use of public transport (mainly those with jobs in CBDs or inner city areas). For the majority of commuters with suburban employment, public transport isn’t an option (and making it one would be even more prohibitive that the costs of the present system). Penalising suburban car commuters thus imposes tax penalties on those least able to afford it for no policy gain. Then there are the proponents of ‘free’ public transport, who might need to explain how providing this service to the highest paid workers in our economy, at the expense of the lowest, stands the test of social equity.

The reality of where jobs are located throughout our metropolitan economies, and the nature of those jobs, should be a starting point for discussions about how to more efficiently manage our transport networks. Unleashing further economic potential in our cities won’t be achieved if the policy discussion is removed from the realities of workplace geography.

This series began with the suggestion that public policy and urban planning has become preoccupied with where we live, and with types of housing choice and form. Little discussion seems to take place about where we work. But where we work, and the nature of those jobs and the demands they make of our urban infrastructure arguably have a larger bearing on urban economic efficiency than housing. I hope these articles have made a few observations about the demography of employment that will promote further thought and discussion – based on realities rather than myth or presumption.


Next and final: the future of employment and how this could re-shape cities.

Monday, April 22, 2013

The demography of employment part 3: heading for a new class divide?


This third instalment of ‘The Demography of Employment’ looks at the different income profiles of city centre and suburban workers in Brisbane, Sydney and Melbourne. The results show some marked disparities based on geography, with the average CBD worker earning a quarter to a third more their average suburban counterpart. The top ten income areas city wide are nearly all inner city areas, and these workers earn more than double the average of the bottom 10 areas. Given that for every inner city worker there are around 7 or 8 suburban workers, the income divide between suburban worker and city worker becomes more stark.

The data referred to in this article has been extracted from Census data and prepared by the team at Urban Economics – an urban research company based in Brisbane. There are plenty of spread sheets to back up the statistics that follow so if you have further interest in this subject, I suggest you give them a call on (07) 3839 1400 or email Kerriane at kbonwick@urbaneconomics.com.au

In each of the three largest capital cities in Australia, the top ten income earning areas are mainly centred around the CBDs. Workers in central business districts areas earn on average between $80,000 and $90,000 each per annum. For working couples where both have city jobs, that’s a healthy household income of around $160,000 to $180,000 per annum.

Their suburban counterparts don’t fare so well. Average non CBD incomes are around $50,000 per annum. A working couple, on average, might bring home $100,000 per annum, a substantial $60,000 or even $80,000 less than their CBD worker counterpart. (These are just averages of course and good for order of magnitude comparisons only. It’s like the story of the economist who, with his feet in a bucket of ice and his head in a hot oven proclaimed ‘on average, I feel fine!’).

There are good reasons for this. CBD workers are likely to have higher standards of education and more saleable skills, working for businesses which pay a premium for talent in white collar industries such as finance, property and investment. Suburban employment typically leans more to retail and wholesale trades, and more blue collar industries where higher incomes are harder to earn. For areas in the suburban economy which are highly reliant on retail employment, for example, average incomes fall to around the mid to high $30,000s. Across all of our major metropolitan areas, there are many more people and families on these lower income levels than there are families where income earners enjoy inner city jobs and the pay packets that come with them.

Brisbane.

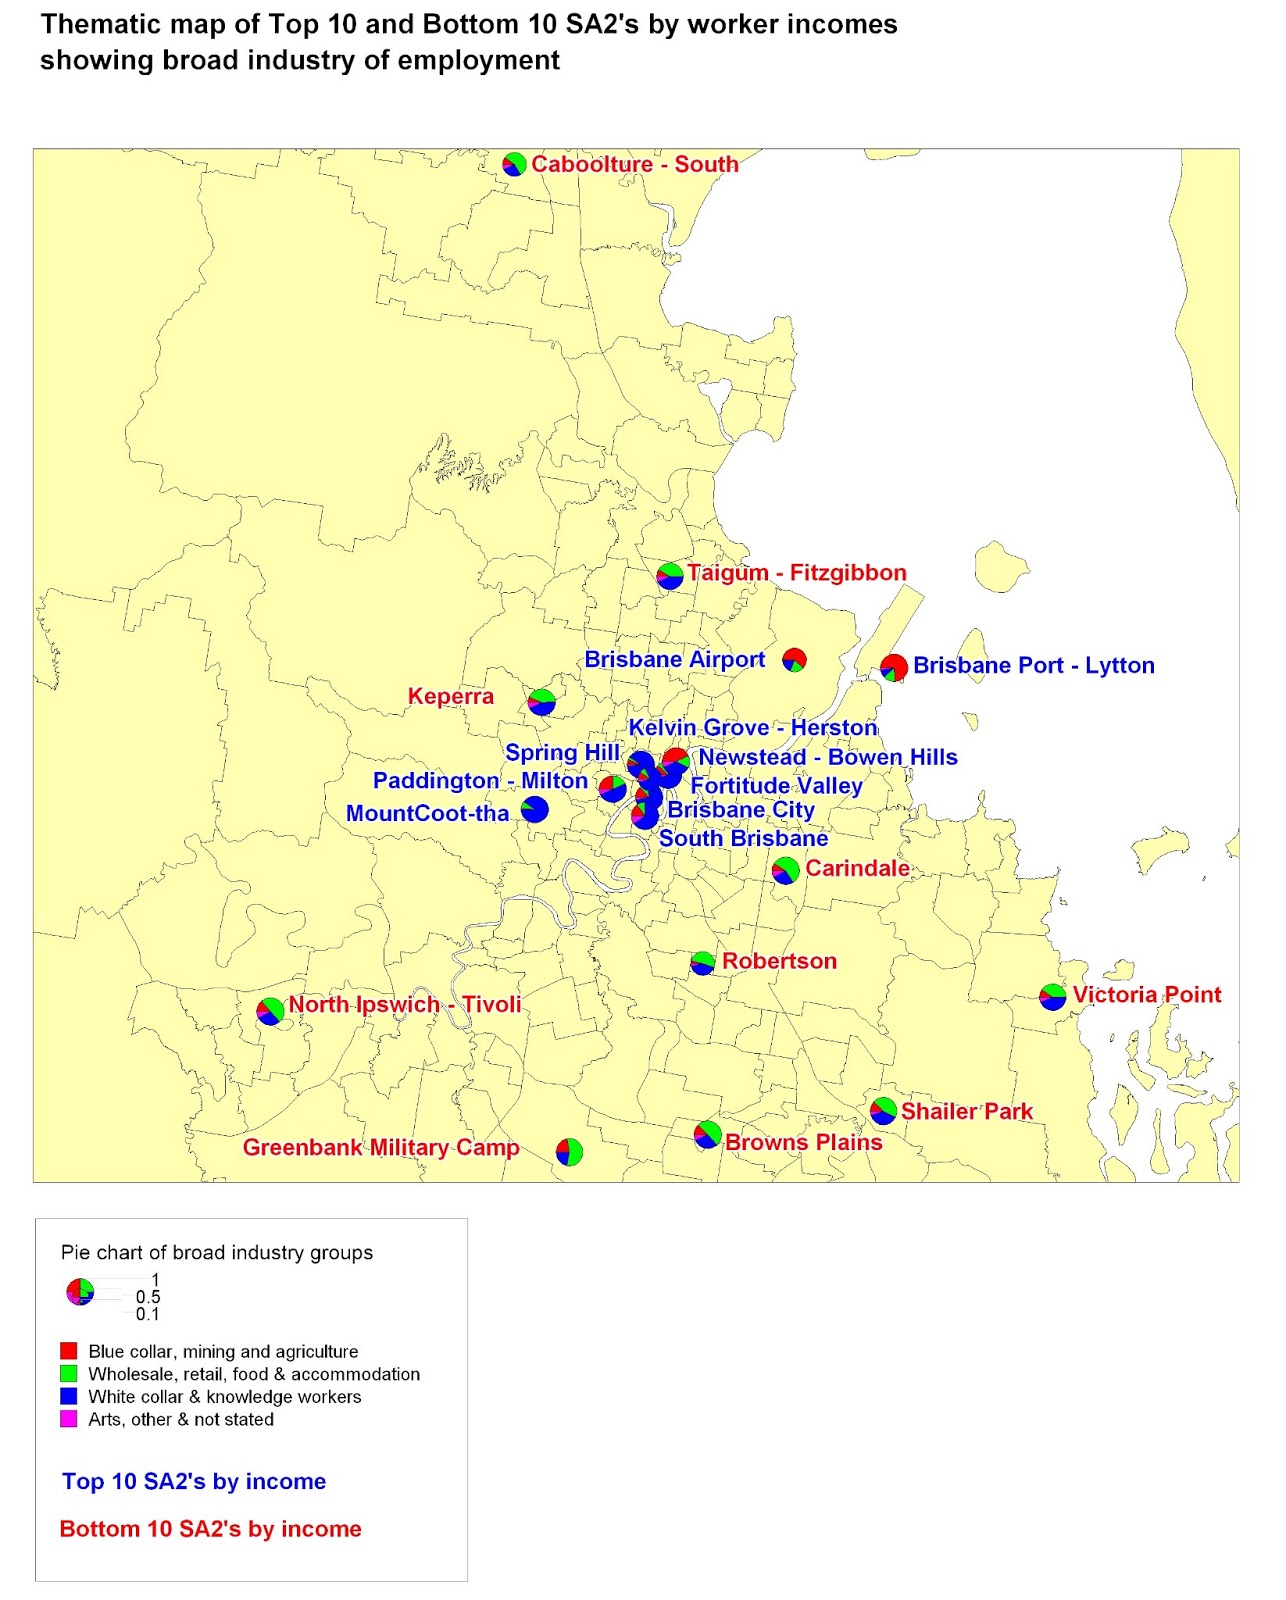
Highest average incomes in Brisbane are for jobs in the CBD, at $81,500 per annum. Second is inner city Newstead-Bowen Hills ($77,330) and third, Spring Hill ($75,880). But where the CBD and Spring Hill jobs are white collar knowledge workers and public servants (75%), there are only 35% of these types of workers in Bowen Hills, where 43% of jobs are blue collar. Adding to evidence that all high incomes aren’t always white collar are the Brisbane-Port Lytton area and the Brisbane Airport area, which are the 6th and 8th highest income areas in Brisbane with 74% and 62% of jobs classed as blue collar. But these are exceptions to the rule, with all other top ten income places taken by inner city areas.

Conversely, the bottom ten are nearly all outer suburban, led by Greenbank, then Caboolture, Taigum-Fitzgibbon, Robertson, Keperra, Victoria Point, North Ipswich, Carindale, Browns Plans and Shailer Park (incomes ranging from $33,710 to $37,770). The types of jobs are weighted more heavily to retail and wholesale trade, food and accommodation (roughly half of all jobs in these areas). Of interest is that even Taigum-Fitzgibbon and Keperra show a high percentage of white collar jobs for suburban areas (43%) but are still in the bottom ten. A white collar job it seems is in itself no guarantee of a good income.

Across the city, the average suburban job brings home $47,994 per annum while the average inner city job brings home 25% more at just over $60,000.


Sydney

North Sydney comes first for incomes across the Sydney region, at $93,410 per annum average. North and East Ryde are next ($89,570), followed by the CBD and Rocks ($89,210). At fourth and fifth place are the suburban employment centres Macquarie Park and West Pennant Hills. The latter has 80% of jobs in white collar positions but Macquarie Park is more evenly split between retail, wholesale and hospitality (29%) and white collar (54%) jobs. Further intensive development planned in this area will soon change these ratios.

Port and airport areas also feature in the top 10, with Port Botany ($75,560pa) and Banksmeadow ($75,210pa) showing that having 65% and 66% of jobs in blue collar roles is no barrier to a top 10 average income.

Sydney’s lowest income areas are around Bateau Bay, Roselands, Gorokan, Budgewoi, Casula, Cambridge Park, Umina, St Albans, Wyoming and Cabrammatta West, where average incomes range from $37,050 to $39,820 per annum. Here there are higher proportions of jobs in retail and wholesale trade (typically around 40% to 50%) but there are also reasonably high proportions of white collar jobs (mid-30%s to mid-40%s). Once again the evidence seems to say that a white collar job is no guarantee of a high income.
Across the Sydney metropolitan area, the average income of inner city workers was around $66,929 per annum and for their suburban counterparts, substantially less at $51,715 per annum.


Melbourne

Melbourne’s top ten income areas were almost all exclusively inner city, led by the Docklands ($87,300) a good way ahead of the CBD ($81,640). Then follow South Yarra, Southbank, Albert Park, East Melbourne, South Melbourne, West Melbourne and Abbotsford (the latter on an average of $70,250). Glen Iris – East is the only non-inner city area to make Melbourne’s top 10, coming in at number six ($76,300). All are largely white collar locations, with the exception on West Melbourne where 64% of jobs are blue collar and only 6% classified as white collar.

The lowest income areas across Melbourne are all outer areas, led by Taylors Lakes ($34,230) then Hoppers Crossing, Maribyrnong, Chirnside Park, Altona, Melton, Mill Park, Frankston, Meadow Heights and Mount Dandenong ($38,290). Altona Meadows and Frankston North show relatively high proportions of white collar jobs (46% each) which again is evidence that this is no guarantee of an area reporting higher average incomes.
Across the Melbourne metropolitan area, the average suburban worker earns $48,188 per annum, while their inner city counterpart brings home 24% more on $59,758 per annum.


Implications.

Earlier in this series we showed that suburban jobs outnumber city and inner city jobs by around 7 or 8 to one. We also know from the census results that inner city workers aren’t just in the minority by nature of location, but they are also in the minority by way of income. In both cases, it’s a case of being in a privileged minority: inner city workers earn on average a good deal more than their numerically superior suburban counterparts.

These averages aren’t always due simply to the nature of employment. Some suburban areas with relatively high levels of white collar employment are still featuring at the lower end of the income scale. Conversely, some areas with high proportions of blue collar employment also appear at the higher end of the income scale. (Mining, a non-urban industry is beyond the scope of this study but for the curious, the top 10 Australia wide areas for income are all mining regions, with incomes above $100,000 per annum).  So there are some grounds to suggest that location, as much as the nature of industry, has a significant bearing on income.

The evidence clearly shows that inner city areas have higher incomes. In many cases, considerably higher than suburban or outer suburban jobs. Our inner city areas are places of privilege in terms of the jobs they provide but also in terms of the riches of social infrastructure funded by the taxpayer. Heavily subsidised public transport networks are mainly designed to get inner city workers to and from their higher paying jobs. Taxpayer funded cultural, recreational and social infrastructure is concentrated in inner city areas, arguably where it is of more benefit (it is certainly more accessible) to inner city workers than residents of middle or outer suburban areas with suburban employment.

With so much intense discussion about urban growth and development typically focussed on what happens within a 5 kilometre radius of the CBD, it is fair to ask if this intense focus has diverted attention away from the needs of the majority of lower income (suburban) workers, to the benefit of the numerically smaller but considerably richer, inner city workers. The latter, based on the evidence, have a greater capacity to pay for the infrastructure they enjoy than the suburban worker and taxpayer.

This poses a challenge for policy makers and opinion leaders, many of whom are not only CBD or inner city workers themselves, but also residents of the inner city or near city areas. Living, working, shopping and pursuing high-end leisure pursuits in this privileged environment could lead to distorted views of the broader metropolitan economy. The CBDs and near city areas are seats of government and the headquarters of major companies. They are also typically where decision makers and opinion leaders in corporate life, public policy, the media, and industry groups live and circulate. It is easy to suspect that a good proportion of them don’t move much beyond these geographic confines.

I was reminded of this a couple of months ago when Prime Minister Julia Gillard decided to descend on the people of Rooty Hill, in Sydney’s west, hunting for votes. Following her went the Sunrise Show, the Today Show, and much of the press gallery. The footage I saw of them traipsing around Rooty Hill looking for ‘the real people’ reminded me of travellers in a strange land, encountering cultures and people quite alien to them. The people of Rooty Hill and western Sydney may well have breathed a sigh of relief when the circus left town a few days later. (Ironically, and in a classic display of how sad public policy making has become, the Prime Minister made some grand promises about an additional $1bn funding for a major highway upgrade to better connect the west to the CBD. This was despite the evidence which shows - though mustn’t have been consulted - that only a very small proportion of the people living there actually work in the Sydney CBD or its surrounds. The presumption seemed to be that Rooty Hill’s salvation lay in a better connection to the CBD. Asking the people of Sydney’s west what they really want may have revealed something else altogether).

The point here is that the income divide between city centre and suburban economies poses a challenge for policy makers. High income elites who work, live and circulate largely within a defined radius of the CBD could, unchecked, tend to dictate urban policy for the entire city, based on their limited perspective. We’ve seen elements of this surface in the disdain with which suburban ‘McMansions’ have been derided, or how the supposed ‘love affair’ suburban workers have with the private vehicle has been attacked.

It’s a fair question to ask whether the significant investments in inner city social infrastructure through urban renewal schemes, cycle ways, river and harbour side pedestrian walks, bicycle schemes, parks and gardens, cultural facilities and the rest have been balanced with equal emphasis on similar amenities for suburban employment centres.  

These inner city investments have largely relied on public policy support and taxpayer funds, but they have also leveraged private capital which has had the confidence to further invest in this environment. If a similar partnership could attract more private capital investment into suburban employment  areas, it could lead us in the direction of more significant economic benefit city wide, as opposed to concentrated benefit in the CBDs and inner city areas.

Next: transport and employment.