Sunday, December 5, 2021

Eyes wide open: the cost of commuter rail


There are a number of folk getting quite excited at the prospect of some serious new investment in heavy commuter rail, as part of the Brisbane 2032 Olympics infrastructure legacy, but also with projects like Melbourne’s suburban rail loop. There’s no doubt that improved public transport connections are a good thing. But they can - in the case of heavy rail - be also very costly. The phrase “be careful what you wish for” seems apt.

The Moreton Bay (Redcliffe) line north of Brisbane serves as a recent and useful example of cost and commuter usage. None of what follows suggests it should not have been built. But the costs of the project, relative to its actual use by the community and the ongoing operational costs, are a reality the taxpayer is entitled to be aware of. If they’re unaware, politicians and consultants extolling the upsides should also be honest about the costs, because they are playing with other people’s (taxpayer) money.

The rail line to Redcliffe was first proposed in 1885. It was finally opened 130 years later in October 2016 (proof that trains really don’t run on time?) The line is a 12 kilometre extension of heavy gauge, dual track electrified commuter rail from Petrie to Kippa Ring.

The project cost $1.2 billion and includes six stations – Kippa Ring, Rothwell, Mango Hill East, Mango Hill, Murrumba Downs, and Kallangur. That’s $100 million per kilometre, including the stations, or $100,000 per metre of line distance covered.

According to Queensland Rail data, the total number of passengers boarding the line via the six stations in 2018 is a combined daily weekday average of 4,291. That was pre-Covid, and numbers broadly dropped by a third due to the pandemic. The pre-Covid numbers are a fairer representation of demand so we’ll use them.

The busiest station was Kippa Ring (989 people boarding daily), followed by Mango Hill (895) then Kallangur (703), Mango Hill East (672), Murrumba Downs (562) and Rothwell (470).

Assume that daily boardings are a proxy for the number of users (most people who board also disembark as it’s typically a return journey, and most people do this regularly for their commute). So assume it’s broadly the same 4,291 people using the line each day for commuting. There are also a small number using the line on weekends but this is unlikely to be for work so as a congestion buster, it doesn’t really qualify – heavy commuter rail is never justified as a weekend recreation service but as a weekday commuter service.

If the new line cost around $1.2 billion and is used by around 4,291 regular commuters, that’s a capital cost of $279,655 per passenger. That’s a big number.

Plus there’s the operational costs. Prior to Covid, the Queensland Government subsidy per rail passenger, per trip, was $21.15. (This number doubled when numbers fell in Covid). That subsidy is in addition to the train fare. So every time a passenger pays their fare, the taxpayer pays an additional $21.15. Per person, per trip. That’s $42.30 for a round trip, in addition to the fare.

(Buses were subsidised $4.02 per person per trip – a fraction of the cost of rail. Not only are buses much cheaper as public transport but they also make use of the existing road network, they can be re-routed in response to changing needs, and can be efficient with fewer passengers – none of which you can do with rail).

So for each of the 4,291 regular rail users on this line, the taxpayer is contributing an average $42.30 per day, or $211.50 per week per user. That’s $907,546 in total per week for all users. Call it a million dollar rail fare subsidy per week for travellers on this line alone.

I’m told the famous Sir Leo Hielscher, when head of Queensland Treasury, used to try hose down politicians’ enthusiasm for heavy commuter rail projects by telling them it would be cheaper by far to give every person likely to benefit a free taxi voucher, for life.

Scarily, these projects are often proposed on the assumption that they will meet a commuter demand from frustrated motorists sick of congested roads. Which they would, if most of those motorists were trying to go where the train lines take them – the inner city and CBD. But with more than eight in ten residents working in suburban locations (not typically served by rail), this math was never going to add up.

It didn’t stop the pollies though. Said acting Premier Jackie Trad at the time: “A project like this, that will see 600 new trains go from the Redcliffe Peninsula to the city CBD every week, is a fantastic initiative for workers in this area.” Even though the overwhelming majority of workers in the area don’t work in the CBD.

Opening the rail line, then Prime Minister Malcolm Turnbull also made a raft of silly comments including that “Realistically, someone could jump on a train here in Kippa Ring and use our public transport network to visit the beaches of Gold Coast or Sunshine Coast.” Memo to Malcolm – let’s buy them airfares to visit Fiji. It would be cheaper.

The same story carried this justification for the line: “The Moreton Bay region is one of the fastest-growing in Australia with the population of 375,000 tipped to reach 500,000 by 2031.” True. But this does not mean they’ll be commuting to the Brisbane city centre for work.

It added: “Over 80 per cent of people in the region (83%) use a private car to drive to work each day.” True again, but they do so because the car will take them when and where the train doesn’t.

Are there better ways around this, which could be explored? One might be to rethink the idea that suburban rail stations are mainly a place for CBD-bound commuters to board for their journey to work. Instead, why not explore options for suburban stations as the destination? A place to get off because your work in a mixed-use precinct is within a short walk of the station? There are stations that meet this potential.

Or what about locating schools next to stations? Would it not be a good idea to be able to get off the train when the station is incorporated with the school, for safety and convenience of students and staff and parents. There would seem to be ample land surrounding stations in some cases. Very large 
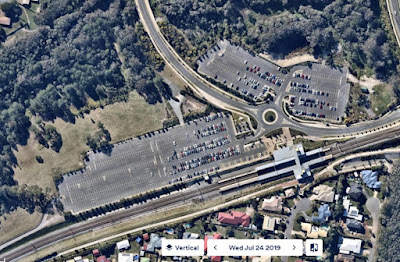
on-grade areas set aside for commuter parking aren’t always fully utilised. Like this image of Murrumba Downs station (taken on a weekday in pre-Covid July 2019, with barely a third of spaces taken). Why not a multi-deck park and ride to cater for commuters (the cost to park for the day could include your rail fare) which in turn frees up some of on-grade land for a school?

Whatever the options, it would seem sensible to evaluate future proposals for heavy commuter rail through some different lenses. If we are to add massively expensive heavy rail upgrades to meet future transport needs, it would be nice to think that we are fully informed of likely costs, realistic projected user numbers and that all options to maximise the economic and community value of the stations have been explored.


Monday, October 18, 2021

Populate at peril?


We are fixated on population growth as a positive thing, which it can be. And we’ve become accustomed to rates of growth which have been absolutely extraordinary in global terms. Up until Covid turned the tap off on net overseas migration, we were projecting growth rates for our major cities which put them in the same league as cities such as Shanghai and Beijing. To think we were actively planning to grow Brisbane, Sydney and Melbourne by close to a third in the space of just 15 years is quite remarkable if you pause to let that sink in.


Recent events though have shone a different light on how that growth is working out for China’s mega growth cities, with Evergrande possibly the tip of an even larger speculative iceberg.

There are warning signs about growth here as well, and while it is good to welcome interstate and overseas arrivals once again, we could spend a little less time cheering on the numbers and more time planning for what’s needed to support them.

There are very prominent and entirely mathematical consequences of rapid growth that we have proven to be epic failures at when it comes to planning and delivery. The first example is congestion. Here in Queensland we seem to salivate at the prospect of more interstate arrivals fleeing southern cities as Covid restrictions lift. This will boost demand for housing yes, and will likely mean more pressure on house prices – a good thing for owners, but bad news for those not yet in the market. 

But consider this: for every 10,000 increase in population, we put between another 6,000 and 7,000 extra cars onto the roads. Mostly the same roads and the same capacity as was there 20 or even 30 year ago. Inevitable, mathetical consequence? More congestion.

According to the people at Charting Transport, the ratio of cars to population peaks initially at around .75 per person for people aged mid 20s, then falls to around .55 person for those aged around 40, and rises again to .85 per person for those aged around 65. So an overall ratio of say .6 to .7 per person equates to around 6,000 to 7,000 cars for every extra 10,000 of population. 

When you next hear someone predicting another 1 million people in South East Queensland, just keep in mind that will mean another 600,000 to 700,00 cars. You’d better want to be living close to work by then.

Plans to increase road capacity are limited, and suggestions ‘more public transport’ will alleviate the issue are mostly wishful thinking. This could work if of those 10,000 arrivals, a large majority worked in industries or in locations that work for public transport. That mostly means the city centre. But the evidence is overwhelming – of a 10,000 increase in population, 60% of those aged 15 years and over will have jobs, and of them more than 9 in 10 will be in suburban locations, many in industries like health, education or construction. And of those of school age and below 15, we seem locked into the habit of being personal uber drivers for children, using private cars to drop them at their schools or sporting events. So most jobs associated with that extra population won't be in places capable of efficient public transport because that's the locational nature of those jobs. And unless we change our parental Uber habits, more school kids will also mean more cars on roads. 

Another consequence of growth is played out regularly in the form of strains on our health system. For every 10,000 extra people, you need extra hospital beds and related medical services. That’s not going so well. According to recent comments by Australian Medical Association Queensland President Professor Chris Perry, “We’ve had ramping for a long time, we’ve had code yellows for a long time … but it’s getting worse because our population is ageing and our population has doubled in the last 30 years, and our hospitals haven’t increased in size, really.”

More people need more of everything in fact. Our ratio of hospital beds to population is around 3.9 per thousand (which is below the OECD average of 4.3) so just to maintain pace, for every extra million people, we need another 4,000 hospital beds. For context, that’s roughly equivalent for four PA Hospitals (a major public hospital in Brisbane for non-Queensland readers).

Extra people also need extra schools, community facilities, even extra prisons. Each consequence of growth is calculable with a range of existing, proven mathematical ratios. Yet how much of our thinking is spent on how we are going to deliver on the consequences of growth, rather than just blithely cheering on the headline numbers? Failing to match the growth numbers with infrastructure and facilities to support a larger population actually leads to a declining quality of life. Maybe we could start thinking more about that aspect of growth as much as the headline numbers when post Covid growth numbers return?

Tuesday, September 28, 2021

Rail station predictions may not be what they seem


There are a lot of rubbery (some plain wrong) numbers quoted when it comes to public transport use, and it seems that trains and train stations are among the worse offenders. Perhaps because the costs of maintaining, operating or expanding network facilities are so eye watering, the promised benefits need to be overstated?

Let’s start with some context. Pre covid, there were around 1.5 million people with jobs in the South East Queensland region. Of that, around 120,000 were located in the CBD and this grows to around 200,000 including inner city locations.

Of the 1.5 million workers, around 60,000 to 70,000 people used a train as part of their journey to work. Nearly all of those people – 84% in fact – board or alight at one of the six current inner-city stations. The busiest was Central Station (roughly half of the station traffic) with around 33,000 people but numbers drop quickly to second place Roma Street (roughly 9500) and Fortitude Valley (nearly 5000).

Fast forward to some of the promised traffic volumes associated with the new CBD stations being delivered as part of Cross River Rail. Overall rail passenger numbers are generally forecast to increase massively. As Engineers Australia observed in a 2017 submission: “The average daily user demands stated in Section 4.2 of the Request for Project Change report equate to a level by 2026 of 208% of the 2015 levels (equating to an average annual growth rate of 6.9%pa over that 11-year period), and a level by 2036 of 289% of the 2015 levels (equating to an average annual growth rate between 2026 and 2036 of 3.3%pa).” 

The Cross River Rail website claims the new Roma Street station will handle a surprisingly precise “46,320 users per day by 2036.” The same for the new Albert Street station, officially predicted to have 67,260 users by 2036.

If it were true that 67,000 users were to use the Albert Street Station and 46,000 will use the Roma Street Station, that would be equivalent to 113,000 users, or around 95% of today’s total CBD workforce, or almost double the number of people who currently (pre covid) use the entire City Train network.

It is probable the term “users” actually refers to total traffic volumes, not individuals. The Cross River Rail website isn’t clear on this but on this basis, you would roughly halve the predicted station “users” to get to the number of individuals, because most people arrive in the morning and leave in the afternoon using the same transport mode (the one individual ‘uses’ the station twice in the same day). This would mean these two stations would be serving maybe 56,000 people daily. But that is still a very big number; close to the total number of people using the entire rail network in 2016, and just from two stations. Either way, the projections appear optimistic, particularly given recent trends.

Public transport tends to be very much a CBD thing. Across South East Queensland, according to this Queensland Government publication, total mode share of public transport is 20%. That’s for trains, buses, ferries etc. A further 76% use the private car. For the CBD, public transport mode share rises to 76% and only 21% use private car.  This is worth keeping in mind because public transport’s ability to relieve congestion is highly correlated to the number and proportion of jobs in the CBD. The numbers have been relatively stable and the proportion is falling as the economy changes.

The predictions for station numbers could assume heroic growth in CBD job numbers by 2036 but this seems unlikely: CBD job numbers have been growing at only around 1% per annum (2011 to 2016) while suburban jobs have been growing at twice that rate (largely due to rapid growth in health and education).

And yes, our population has grown and is forecast to increase substantially in years ahead but has this automatically translated into higher rail passenger numbers? It would seem not. Ten years ago Central Station had 33,000 people using it daily. According to a special data run by a friend in the industry, that number in September 2019 (pre Covid) had fallen to around 28,500.  Then there’s been the impact of Covid, which has seen CBD station numbers drop by 30% on pre Covid levels, and inner city station numbers drop by 35% (June 2021 compared to June 2019). Too many people have not returned to work, and too many of those who have are choosing different means to get there. This in a state which has escaped lengthy “stay at home” orders arising from Covid.

The long-term impacts are unknown at this stage but some things seem probable. CBD job numbers appear unlikely to grow quickly for the foreseeable future. If many choose to continue to work from home for even one or two days a week, that will reduce overall demand. Plus, there may be a continuing hesitancy about use of crowded public transport networks. Meaning the promised numbers for station traffic will need to be treated with extra caution.

On the flip side, there is no doubt the addition of new, contemporary stations in the CBD will add value to the appeal of train travel and overall network performance. The new stations will enrich and enliven the precincts in which they are located. More frequent services and more conveniently located stations are a good thing for CBD workers who can use the train.

For suburban workers who cannot use the train for their intra-suburban work trips (which account for more than 80% of all jobs), it’s not so good – especially if your trip includes having to cross one of the many rail level crossings. More train services will mean more time with the boom gates down, meaning more congestion and longer journey to work times, until these are fixed.

Wednesday, August 4, 2021

Interstate migration: behind the headlines.

Interstate migration is one of those news stories that media networks love because of the easy headlines and “human interest” angles. Real estate people love them too when the numbers help them boost market interest. The latest data release from the Australian Bureau of Statistics achieved both in Queensland. But what’s the deeper story behind the headlines? (click on the graphs to enlarge).

This graph provides the very long-term view of net interstate migration to Queensland since 1982. The net figure is the result of arrivals less departures. A low net figure doesn’t mean no arrivals. It just means as many departures as arrivals. (For example, the latest June quarter number of net 7,035 interstate migration to Queensland represents the difference between 28,500 arrivals and 21,465 departures. You could in theory have 100,000 arrivals but if matched by the same departures, your net growth is obviously zero. But it’s the gross number that contributes to real estate transaction volumes; the net signals an increasing market size).

I have provided an annualised estimate for 2021, simply to put the figure into context. We are a long way off setting records. The early 2000s, the mid 1990s and the late 1980s were all much stronger periods. (This was both because arrival numbers were high and also because departures were relatively less).

The other thing to keep in mind is that the records of the late 1980s and early 1990s were being set when Queensland’s total population was around 3 million. It is now 5 million. So to have the same impact on growth as 50,000 did on a population of 3 million, today’s numbers would need to annualise around 80,000 net interstate arrivals. We are a long way from that.

The next graph (above) charts net interstate migration by quarter for the last decade, showing the five larger states. Queensland has consistently seen larger net numbers, driven mostly by net departures in recent years from NSW but also from WA and South Australia. Victoria’s numbers crashed with Covid.

The ABS now kindly also provide data on net migration to large metro areas. As this graph above shows, Melbourne’s exodus was record setting in every respect. Some escaped to regional Victorian towns (Ballarat, Bendigo, Geelong) while many headed out of the state. The Hume Highway north must have been busy in this period. Sydney has also been losing people but the exodus has been consistent and not as marked by Covid. The greater Brisbane region has gained but a sharp upward spike to match Melbourne’s sharp Covid related decline isn’t evident – higher growth has been occurring in the balance of the South-East Queensland region. Developers on the Gold and Sunshine Coast might attest to that.

Lastly, the source of net migration to Brisbane is the combination of intrastate and interstate arrivals. Here you can see that for much of the last five years or so, net movements from within Queensland to Brisbane were contributing almost as much as movements from interstate to Brisbane. This wasn’t the case for the 2003 to 2013 period, where more people left Brisbane for elsewhere in Queensland than arrived. The curious thing about these numbers is the much-discussed city-for-regions exodus isn’t showing up yet. That might be revealed in later data but for the June 2021 quarter at least, more people arrived in Brisbane from elsewhere in Queensland, than left.

The graph also shows the recent increase in net interstate migration to Brisbane which has the media and boosters excited, but it also shows this isn’t anything to get overheated about yet compared with previous “booms.”

The question that needs to be asked about all this is: is net migration a good thing? To me that depends. If population growth is fuelled by migration of lower skilled, limited resources migrants, that puts a strain on the receiving economy, because they consume more services than they contribute to (at least in the early years). But the arrival of highly skilled migrants with financial resources can contribute sooner. This is what happened in the late 1980s and early 1990s – interstate migrants came with a full-time job waiting for them, and surplus cash from the arbitrage of their house sale in Sydney or Melbourne.

What happens next after extended Covid city-wide lockdowns will be interesting. The 2032 Olympics lure and the jobs that could accompany it could see numbers to the SEQ Region lift in the medium to long term. But as with all things Covid, the question of what happens next is a lot of guesswork.

If you want to explore all the data yourself, you can download the raw numbers from the ABS website here: https://www.abs.gov.au/statistics/people/population/regional-internal-migration-estimates-provisional/latest-release#data-download


Monday, August 2, 2021

Employment in a Covid economy

The impact of Covid-19 shutdowns on much of the Australian economy was variously predicted to be anywhere from apocalyptic to benign, depending on which industry you most followed, which commentators you believed and what news networks you watched.

It is now more than 18 months since Covid escaped the City of Wuhan in China, with just under 200 million reported cases worldwide and 4.23 million deaths with Covid since. And counting. At the time of writing, much of Australia’s population is in lockdown or under severe restrictions on economic activity. Having so far survived the economic impacts of Covid-19 relatively unscathed (provided you are not in hospitality or tourism or a number of equally impacted industries), it could be timely to look at how employment numbers have fared.

In this analysis, I only refer to full time jobs. Impacts on part time jobs in industries like tourism and hospitality will have been more profound because these industries typically employ many more part time or casual workers. But it takes a full-time wage to justify a mortgage and I prefer this measure to total employment for that reason.

First, the five- and ten-year change in employment by region – kindly broken up for us by the Australian Bureau of Statistics into greater metro region, and ‘rest of state.’ (click on the graphs to enlarge).

The power houses in the last decade have clearly been the greater Melbourne and greater Sydney economies. For perspective, those two economies in the last decade added 694,200 jobs to Australia’s market – easily exceeding the 417,400 new jobs created across everywhere else in the country. This could be a good thing if you lived in either, or a bad thing if you didn’t. It does suggest we were developing an “all the eggs in one basket” dependency on metro Sydney and metro Melbourne. With such a dependency comes a lack of resilience of course. If those two economies sneeze (very sorry for the pun in a story about Covid and the economy), we all get very sick.

The five-year numbers show however that that differential gap was narrowing. In the most recent five years, metro Sydney and Melbourne added a combined 384,300 additional full-time jobs, which was broadly the same as the 404,200 jobs created elsewhere. So they went from contributing 63% (roughly two thirds) of total new national full time jobs in the last decade to 49% (let’s call it half) in the most recent five years. Still with a lot of eggs in those two baskets, but not quite as many as before.

Now let’s look at the change in full time jobs since Covid escaped Wuhan.

The impacts weren’t really felt in Australia until February – March 2020 when the first outbreaks (and lockdowns) began to appear in Australia. The greater Sydney story since then – roughly an 18 month period – has fared the worst, shedding 20,000 full time jobs. The higher they climb the faster they fall maybe? Also suffering a reduction in full time jobs were greater Melbourne, along with the balance of NSW, the balance of Victoria, greater Adelaide and the NT. (That impact in the NT, given its smaller overall size, would be more sorely felt, so keep that in mind for our NT cousins).

The star performer since Covid has been greater Brisbane, which added 25,000 full time jobs, followed by the rest of Queensland. That’s very interesting (and encouraging for us Brisbanites) and could explain the reported bump in interest from interstate migrants. Brisbane was coming off a smaller base (see the first graph) and is yet to emerge from Covid unscathed, so it may be too early to read too much into this encouraging news.

Looking more closely now at how the major metro economies performed in this period (and apologies to SA, the NT, Tassie and the ACT but you don’t fit on the graph and doing so renders the scale meaningless). All major metro economies came out of December 2019 with a dip, with Sydney and Melbourne picking up by February 2020 but then taking their long term declines into the year and beyond. Sydney hit its low spot in May 2020 and began to claw back from then. Melbourne hit its low spot in September 2020 and has staged a solid turnaround since then. Brisbane’s low spot was in May 2020 and it now has more full time jobs since Covid began. Perth was not as badly affected during Covid and also now has more full time jobs than since the pandemic began.

The big question is what happens next? Some believe Brisbane is entering a ‘golden decade’ of growth, spurred on to an Olympics 2032 target. The declining interest in overpriced metros like Sydney and Melbourne could drive more people and jobs across the border into Queensland, or into more regional centres of those states. Certainly, this is happening in centres like San Francisco, New York or Los Angeles. Why pay exorbitant prices for housing and still have to commute long hours to a job you can do equally well in a better and more affordable home in a better suburb, seems to be the rationale.

Then again, the same forces that drove Sydney and Melbourne to account for half the jobs growth across the country for a decade, could return. If they do, I suspect it will take time.

The reality is that this has further to go. Australia’s initial resilience in terms of full-time jobs owes much to the Federal Government’s Jobkeeper and related support packages. They have now run their course (adding eye watering sums to our debt in the process). What happens next will very much depend on the extent to which we overcome irrational vaccination fears and allow our economy to open up more fully without intermittent, unpredictable and highly damaging lockdowns. Here’s hoping we don’t have long to wait.

Sunday, July 11, 2021

The Census Clairvoyant - futures told


The Australian Census is coming. It will be on Tuesday 10th August. That’s the only prediction I am likely to get 100% right.

What are some of the key themes that might be revealed by a Census taken in the midst of a pandemic? I have one prediction which might sound counter intuitive. If I am right, you can praise my insights and almost psychic forecasting powers. If I am wrong, I will bury this article and forever deny its existence.

So what’s the prediction? I am going out on a limb and will suggest that despite all the debate and discussion about Covid-19 and working from home (WFH), the increase in the overall proportion of people working from home won’t be as great as much of the media might have you think.

For some context, the proportion of all Australians who worked from home in previous Censuses has been relatively stable. In 2006, it was 4.88%. In 2011 it was 4.48%. In 2016 it was 4.75%. (Thanks to Urban Economics for the numbers). That period saw an exponential growth in technological capacity, but it was a virus that finally achieved what technology could not – sending many CBD workers out of the office and home to their kitchen tables. And many are politely declining the opportunity to return. This recent article titled “The five-day office week is dead, long live the hybrid model, says productivity boss” features research by The Melbourne Age and Sydney Morning Herald of 50 of the largest office worker type companies. The research indicates “an overwhelming majority expect to continue allowing employees to work at least part of the week from home once the pandemic ends.”

That is also reflected in Property Council data which reveals most major CBDs are struggling to get past the two thirds mark of pre-pandemic occupancy. The reasons are revealing, with the majority citing a preference for work from home flexibility over the 5 day commute to the CBD office, not safety or other considerations. This aligns with similar evidence from both the USA and Europe. Working from home will have a lasting impact on CBD and inner city office workers - and their workplaces - around the world.

So how is it I am silly enough to predict that this Census, taken as we begin to emerge from a pandemic (albeit now with Sydney in the grips of another city-wide lockdown), will underwhelm many with the actual numbers working from home? Obviously there will be an increase, and it may even get closer to 10% (which yes, is a doubling on previous years, but off a small base). That would still mean around 90% of Australian workers are travelling to a workplace. Why?

First, let’s recall that CBDs only employ around 10% of a metro area’s workforce. We have consistently attributed CBDs with much greater economic function than has been borne out by the Census or other data sources. Those almost mythical powers have perhaps been bestowed on city centres because that’s also where the great majority of government agencies are based, along with the media, many academics and certainly the wealthy professional class. We aren’t very good at seeing the bigger picture outside the inner-city bubble.

Not only do CBDs account for a small proportion of the workforce, they are also relatively slow growing. The Census of 2016 showed – in the case of Brisbane at least but a trend I understand was also found in Sydney and Melbourne – that the CBD was the slowest growing place of work. In the 5 years from 2011 to 2016, it added just 6,354 workers. That’s full time, permanent and part time, from cleaners to CEOs. That was just a 5% increase on the 2011 number, and only a 3% share of the 183,901 new jobs created across the metro region in that time. By comparison, the inner city grew by 7%, the inner ring by 9%, and the metro/suburban region, grew by 12%. The Gold and Sunshine Coasts grew by 25% and 23% respectively. The further away from the CBD, the faster the jobs growth. The trend of the suburbanisation of jobs was well and truly underway already.

Given such a small proportion of the workforce are actually based in CBDs, a major decline in CBD based office work in favour of work from home, is unlikely to have a big impact on census numbers. But what of the other 90% of jobs? True, there are many professionals who work in suburban locations. In Brisbane (and likely also similar in Sydney and Melbourne) 76% of white-collar professionals were based in suburban workplaces at last Census. If these workers also opted to work from home to the same extent as CBD workers, my Census prediction is in dire straits. However, gut instinct tells me that suburban professionals have less reason to opt for work from home than their inner-city counterparts. Their commutes are less for starters. And quite possibly, the return to favour of suburban villages and centres may have even elevated the value of the suburban professional workplace. We will see.

But the major over-riding rationale behind my prediction is that the majority of jobs in the economy are unable to support work from home in the first place. Health and education workers are by definition proximity workers: they need to be near patients or students to work best. And these are now the largest employer industries in the country. Close behind are people who work in retail and wholesale, and transport and logistics. These are occupations which are unlikely ever to be offered a work from home opportunity. How about construction? Hmm, not likely. Then there is manufacturing (still a major employer). Also unlikely. Tourism and hospitality? Not at all – these workers bore the biggest brunt of Covid lockdowns, because they had no “plan b” work from home alternative. Then there are resources and primary industries. Maybe a farmer’s tractor is almost work from home, but that’s a stretch.

The point being that the inner urban professional class tends to overstate its importance in the greater scheme of things. The facts however are that the vast majority of Australians do not live or work in inner cities and have not had the opportunity to work from home in the way that some have. Endless media commentary, industry group statements, politician’s media releases or corporate agonising over the fate of the inner city, will not change that. But we will have to wait for the Census results to find out.

Wednesday, May 19, 2021

How derelict became desirable: renewal lessons for today

When the Hawke-Keating Government in 1991 announced the Better Cities program to revitalise previously run down (mostly inner city) areas, it was the New Farm–Teneriffe area identified by then Brisbane Lord Mayor Jim Soorley as one ripe for renewal. He appointed Trevor Reddacliff to head an Urban Renewal Taskforce and a 20 plus year program of urban revitalisation was set in motion. The transformation of the area from dilapidated industrial sites to high end housing is worth exploring because the lessons about transforming land uses are as relevant today as they were then. With the New Farm Powerhouse marking its 21st birthday since being transformed from industrial ruin to vibrant cultural centre, this is as good a time as any to do so.

Figure The CSR Refinery, New Farm.

First, let’s remind ourselves of what the New Farm peninsula was like when this all began in the mid 1990s. There was a CSR industrial refinery at Lamington Street. First built in the late 1800s for its river access (the river being the best mode of transport for bulk goods) it operated on this site until 1998, when the Urban Renewal Taskforce successfully convinced CSR to relocate operations. Former Lord Mayor Jim Soorley tells the story that he threatened to blockade the access roads to the site if CSR didn’t see the light. CSR ultimately sold the site to Mirvac, who initially proposed a series of 20 storey residential towers. I can recall that period well, because as a newly minted Executive Director for the Property Council, it was my job to go into bat for Mirvac. That meant taking a very cranky call one day from the then Lord Mayor, who thought such a proposal was akin to vandalism. He - and Trevor from the Urban Renewal Taskforce – have been proven right of course. Mirvac adjusted their scheme which became a much more sympathetic project ‘Cutters Landing.’ Parts of the old refinery building were converted into loft apartments and other elements recycled as public spaces.

Figure The New Farm Powerhouse in its power generation days

Next door was the old New Farm powerhouse. This once generated electricity for Brisbane’s tram network and other uses. It was abandoned and dilapidated, having been decommissioned since 1971. Broken glass windows and graffiti typified the site, which was favoured by the homeless, street kids and drug addicts. The Council at one stage planned to demolish the buildings and turn the area into parkland. But the Council instead pushed ahead with an adaptive re-use plan which saw part of the structure (including the turbine rooms) converted into a public arts and theatre space. That first stage was opened in 2000. Once again, a former industrial use – rendered redundant by the inevitable passage of time – found a new and more relevant life. A more upmarket one too.

Figure 3 The wool stores and bulk stores of Teneriffe with ships at dock

Then there was almost the entire Teneriffe waterfront area, which was typified by disused wool stores and bulk grain facilities. They had been located here in the early 1900s for the river access, so that barges and ships could dock and load or unload goods. The river performed an industrial use, and buildings located near it for that very reason. But by the 1990s, we had highways and freight rail and a new port at the mouth of the river, so like many land uses, its original purpose became redundant. Instead of storing wool or grain, many of these buildings were being used as low-end retail markets or cheap storage space, until they too began a transformation into loft style apartments.

Figure 4  The Coca Cola factory in James Street, New Farm

In the now highly fashionable James Street there was a similar industrial flavour. Coca Cola used to have a bottling factory there which – after being abandoned and falling into dereliction - was bought by Kevin Miller’s Property Solutions Group and redeveloped into Centro Place: a mixed use retail, entertainment and office precinct. Other sites with former industrial uses were similarly acquired and converted into more logical uses with real market appetite. Their industrial histories were no longer relevant to the needs of the day. The once markedly industrial flavour of the James Street precinct had passed into disuse and was then revived with entirely different uses.

The same happened across much of the New Farm-Teneriffe-Newstead area, which went from being a run-down neighbourhood of semi-abandoned buildings, crime and poverty to becoming one of Queensland’s most upmarket communities. In the mid 1990s, New Farm was rated as 21st in the league ladder of median house prices in Brisbane. Today it is #1 with a median house price fast approaching $2million. 

Figure 5 James Street New Farm today.

It now seems logical that refineries, power stations, bulk stores and bottling factories have no place in New Farm, but back then it required some vision and a lot of tenacity to overcome prevailing wisdoms. Trevor Reddacliff – the story goes – once had to be physically pulled away from one particular developer who was digging his heels into the ground over a proposed redevelopment of a disused bus depot. These things were worth fighting for.

It meant recognising that land uses that once suited society don’t necessarily continue to do so. Things change. If we had preserved the industrial land uses of New Farm-Teneriffe hoping for some resurgent industrial activity to miraculously adapt itself into these buildings, we’d still be waiting. New industrial uses need different types of buildings and in very different types of locations. They’ve moved on. It’s not as if ships still come sailing up the river looking for places to dock and load bulk goods, is it? Today, that role is performed by B-doubles – and who wants them trundling around New Farm? They couldn’t fit the road network anyway.

Figure 6  Part of Salisbury Brisbane, today.

Which brings us to many of the legacy industrial sites and precincts which are scattered across our city today. These once made sense to the businesses that operated from them, and the buildings were suited to the nature of activity conducted inside. Saw tooth roofs provided ample ventilation for the heavy equipment and related fumes - let alone heat - of the factory floor. In suburban Salisbury, we once manufactured munitions for World War II. In Northgate we tinned pineapple and other fruits for retail consumption and export (and still do, but to a lesser extent). In Moorooka we devoted an entire stretch of Ipswich Road to motor dealers, in what became known as ‘the Magic Mile.’ In Acacia Ridge, we once manufactured Holdens (the Gemini was produced here). In almost every direction of the compass, you will find legacy industrial buildings and precincts which have simply outlived their usefulness. Some have found a half-life as cheap storage – employing next to no one. Others have very sad looking ‘For Lease’ signs which look as old as the buildings themselves.

In the same way we liberated the industrial land uses which used to dominate New Farm – Teneriffe, we have a similar opportunity to liberate legacy industrial sites across the city. A more contemporary mix of uses, including housing, seems far more appropriate (and market viable) than preserving a land use that is well past its use by date for industrial and manufacturing uses that have either moved on, or disappeared entirely. Holdens are not made in Brisbane anymore. We also don’t make cars in Australia anymore. Let’s move with the times.


Sunday, April 18, 2021

Economy thrives while CBDs dive: the argument that CBDs are the engine rooms of the Australian economy is being tested right now


Many Australian CBDs continue to languish, with major CBDs only at from one third to two thirds of their pre-pandemic occupancy levels, despite the end of lockdowns and the lifting of many restrictions. This is having collateral impacts across the spectrum of CBD businesses that rely on office workers being at their CBD offices. Retail centres, restaurants, coffee shops, newsagents – every occupation and every business that depends on CBD workers and their wallets is feeling the pinch as CBD workers continue to preference their suburban homes as workplaces.

Public transport networks are still running but only at fractions of their pre-Covid loads. A public transport network designed to ferry suburban workers to the scheduled start and stop times of centralised CBD offices is looking increasingly challenged by new work-from-home practices with flexible hours and no commute costs (or time) to central work locations. The private car is reportedly now so much more preferred as a mode of transport that used car prices have risen markedly.

The damage to CBD reliant businesses is indisputable. In an effort to revive flagging public support, some CBD interest groups have called for everything from publicly funded entertainment to free public transport and free parking to stimulate interest in luring workers back. But nothing is free – especially public transport which is an already heavily subsidised service (used mainly by CBD workers due to it CBD hub and suburban spoke structure). There needs to be a strong case for such measures.

The “save the CBD” argument relies on the notion that CBDs are central to the performance of the Australian economy. “Our CBDs have been the nation's productivity powerhouses for decades, but have been sorely challenged by COVID-19 shutdowns. It's important for everyone that CBDs are able to reclaim this economic mantle,' said The Property Council of Australia.

The negative impact of Covid on the central city economy is well illustrated by news bulletins that love nothing more than recycling footage of once busy but now near deserted CBD streets as symbols of economic distress. Therefore, the argument goes, it is responsible public policy for governments (and taxpayers) to support the revival of CBDs. “Thriving CBDs will be critical to Australia’s economic recovery,” said the PCA.

But is that true? Are they important “for everyone”? I could have written those words myself some 15 or 20 years ago, convinced as I was that cities were the “crucibles of creativity” and indispensable bastions of the new knowledge economy. But in Australia today, the evidence seems to suggest that the economy is doing just fine, despite the very real problems of the CBDs.

Employment growth is improving with unemployment falling. According to Marketwatch in March this year: “Employment has rebounded strongly in recent months, in line with a broad recovery in economic activity, the fastest in 70 years.” Unemployment has fallen to 5.6 per cent “just 0.4 of a percentage point above where it was before the mass job losses seen at the beginning of the COVID-19 pandemic.”

As recently as early April, the IMF forecast that Australian GDP would come ‘pole vaulting’ back to a very healthy 4.5% in 2021.  The Chief Economist of the Commonwealth Bank expects the economic boom to continue into 2022. They predict a higher 4.7% GDP growth rate.

Stock markets are also imbued with confidence. The All Ordinaries Australian sharemarket index hit an all time record of 7,331 in mid April.

Even the adverse impact of various politically inspired bans on Australian exports by the Chinese government has evidently failed to have the impact initially feared. This is cold comfort to our lobster, wine and beef industries who have suffered greatly but according to the Grattan Institute “Exports to China have predictably collapsed in the areas hit by sanctions, but most of this lost trade seems to have found other markets."

Meanwhile, the predicted partial collapse of the tertiary education sector – segments of which were heavily reliant on foreign student income – may not yet eventuate. A representative of one of the Universities claiming to be seriously adversely affected confided to me in late March that the adverse impact is in reality looking like being less than 10%, as full fee paying foreign students have enrolled on-line and domestic student enrolments have supported the on-campus strength.

Buoyed by all this, consumer confidence – a critical indicator of economic health – has also hit record levels. According to the latest Westpac-Melbourne Institute Index, “Consumer Sentiment lifted 6.2 per cent in April to 118.8 – the highest reading since August 2010.”  Since 2010 remember… that’s 10 years before Covid, making it a significant milestone.

Business confidence is also strong. A recent Financial Review article quoting a number of sources said: “The disruption to the vaccine rollout and the end of JobKeeper have left business confidence undented – two-thirds of employers say there are few barriers to keeping their doors open and one in four expects to increase staffing levels over the next six months.”

Reflecting much of the confidence in the economic conditions (along with access to cheap debt), house prices in Australia have surged. “Australian house prices are rising at the fastest pace in 32 years, as the Sydney and Melbourne property markets stage a full recovery from the short-lived COVID downturn” according to an ABC report in April quoting Corelogic data. “Prices in Sydney, Melbourne, Hobart, Canberra and Brisbane are all at record highs,” it said. House prices in suburban and regional areas have performed strongest while inner city apartments have not fared so well – meaning the market performance has been uneven.

And living standards nationally, according to consultants Deloitte, have come “roaring back.” So lots of good news all round.

Even the commercial property industry – allegedly beleaguered by the problems of the CBDs – is confident. The latest Property Council/ANZ survey of industry confidence was reported thus: “…property industry confidence levels are steadily bouncing back after recording near-record highs as the sector surges into economic recovery from the COVID-19 pandemic. The national industry confidence for the March quarter continued its upward trend to 142 points, rising 19 index points from the previous quarter at 123. This is the highest index score since September 2017.” 

The highest since late 2017. Meaning, the highest since long before anyone had heard of a Chinese city called Wuhan.

So how can we reconcile claims that “thriving CBDs will be critical to Australia’s economic recovery” when the economic recovery seems well and truly underway, even while CBDs languish?

There is no doubt that CBD property owners and businesses are being severely challenged in the current market. But the evidence strongly suggests that this challenge is largely confined to the inner cities. To suggest that CBDs require government subsidised initiatives because CBDs are allegedly “critical to Australia’s economic recovery” is in stark contrast to what the evidence is suggesting: that Australia’s economic performance is not reliant on CBDs to anywhere near the extent once claimed.

Efforts to seize the virtuous high moral ground of centralised economic superiority are not new. The mythical powers of the inner city have been celebrated by urbanists for decades, often at the expense of suburban and regional economies which were often at the same time subject to derision.

And in fairness, calls for initiatives to support CBDs may have merit. I happen to agree. Markets in temporary stress deserve support, as we do for many industries and for some particular geographic regions - although I don’t see that extending to ongoing business welfare.

At the same time, it’s also fair to remind ourselves that CBDs typically account for just one in ten of metro wide jobs. That proportion is even less on a national basis. CBDs also tend to be home to higher paying jobs. Plus, CBDs tend to enjoy preferential capital spending priorities over high growth outer suburban or regional areas. They are privileged domains, with the best taxpayer funded amenity in terms of public transport services, recreation facilities, arts, culture and entertainment, and are surrounded by some of the country’s most expensive housing. Life inside the bubble was intoxicating before Covid. Now the bubble is in trouble and it seems to be reaching out for yet more support.

Yes, CBDs are important to the economy and important to the life of a city. But what we are seeing unfold is an economic resurgence in Australia which, if anything, has busted the myth that CBDs are central to the wider economic performance of the country. The current economic resurgence is evidence that the economic contribution of CBDs has been overstated while the importance of suburban and regional centres and their economies has been understated, if not ignored, for too long.

So, while we’re called upon for short term support initiatives to revive CBD fortunes, we need to temper that support with the realisation that the wider non-CBD economy continues to do much of the heavy economic lifting. Imagine the potential if we got ourselves more invested in that than we have in the past?


Tuesday, March 2, 2021

Less 'B' in the CBD?


The next Census will be conducted in August 2021, by which time you’d expect economic life has largely settled around ‘a new normal.’ It’s pretty clear that when the data is released on place of work, CBDs will probably have fewer people working in them than the previous 2016 Census, and this may last for some years. Should this be cause for alarm? Maybe not. 

The term ‘Central Business District’ has been in use for so long it’s hard to imagine a different terminology. But the nature of CBDs are certainly changing - fast. There is much more to central districts than just ‘business’ (a proxy for legions of white-collar office workers beavering away in office towers) - the CBD is in reality a highly evolved mixed-use centre with a little of everything. 

But the ‘B’ part is apparently in decline while other uses seem to be increasingly on the rise. 

Before we speculate on the future direction of CBDs it helps to understand how much “white collar business” there actually is within the central district. The 2016 Census tells us that just 122,486 people went to work in the Brisbane CBD. That includes all occupations, and part timers, casuals as well as full time workers. Of the 122,486, there were 92,118 with full time jobs. Only a portion of these would be defined as office workers. 


The Census white-collar industry classifications include things like information and media, telecommunications, finance and insurance, rental, hiring and real estate, professional, scientific and technical, administration and support, and public administration and safety. These totalled 80,832 of the 122,486 workers – or two thirds of all jobs by industry. Let’s also assume two thirds of the white collar industry workers are full timers: this leave us with around 61,000 full time white collar office workers in the CBD. That’s probably undercooked because it doesn’t include those who say they work in mining in the CBD (meaning they are probably office workers too). They add around 4,200. Same with electricity, gas and water industries, many of which would be the centralised office component. There’s another 800 or so. Ditto perhaps postal and transport, with another 4,700 or so. 


None of this is as exact as we might like, but let’s broadly assume around 70,000 to 80,000 full time office workers went to work in the CBD in 2016. That’s not a big number so what else is driving the activity? 

Residents added 9,460 people (maybe more like 10,500 today).  Education was a big contributor – with some 35,900 University students plus a further 6,695 vocational students. They are looked after by 6,265 education workers (already included in the 122,465 workers count). On top of this there are 7,585 hotel rooms, with another 1,000 in the works. At full occupancy, that’s a lot of people. Plus day trippers and people visiting for retail or entertainment or dining. Retail trade accounts for 4,804 of the 122, 4486 jobs, many likely part-time, as with accommodation and food service which accounts for 7,246 of 122,486 jobs. 

Before we declare death by statistics, it’s clear that office workers are not all there is to the CBD: many other industries rely on the office work function for their survival. Just ask any restauranteur or coffee shop owner what life was like during Covid when office workers fled the city office for the home office. 

Consensus predictions for life post Covid-19 are that many will ultimately return to the CBD office, but a significant proportion will not. The impact of fewer office workers and its collateral impact on other occupations is why I think the Census results for 2021 will show a decline in total workforce numbers for the CBD. 

Before we hit the panic button we need to take into account that CBD jobs growth was already some of the slowest in the region long before Covid. In the five years to 2016, for example, the Brisbane CBD added only 6,354 jobs – a growth of just 5% over five years. The Brisbane region in the same period grew by 112,517 jobs or by 12%. In fact, the further from the city centre, the faster the rate of jobs growth. Suburbia was on the move long before Covid-19 drew attention to the fragile loyalties of the CBD market. 

What seems to be happening is part of a longer-term trend, where the “B” in CBD has been changing its traditional location and operational requirements. Some traditional CBD office jobs have moved to the suburbs, and more followed with Covid. But there has also been contraction in traditional white-collar administrative functions, with more centralisation in centres like Sydney. This has taken much of the expansionary heat out of the Brisbane CBD office market. Pre-Covid, total leased space in late 2019 was still below the peak of January 2013. Where it goes next is the burning question.


Metropolitan employment is growing faster, thanks in large measure to industries like health and education – which require suburban not CBD locations. So, what’s left to drive CBD growth into the future?

If the business ‘B’ in CBD flattens into the future, that may not be the case for the ‘A’ of amenity. Nowhere has so much been invested in urban amenity than the city centre. The embarrassment of riches lavished on the city centre has catapulted once third-rate inner city residential addresses to the most expensive in the state, in the space of 25 years. Recent State Budgets have been a very one-sided affair, as the relatively low growth but privileged city centre continues to receive a lion’s share of State taxpayer support, while high growth and under privileged areas are starved of capital. 


The level of inner city amenity will surely mean a changing role for the CBD as its function morphs from one where office workers would duly trudge in by day and leave by night, turning off the lights as they left, into a 24 hour central district of recreation, entertainment, learning, living and culture. A quick scan of some of the projects underway or proposed confirms that theme – Brisbane Live (a CBD live entertainment venue), Queens Wharf (Casino, shops, hotel rooms), a new CBD campus for Griffith University – these are major projects, which are not reliant on a traditional office worker model. 

There will always be office workers – centralised office functions, C-level corporate functions, seats of government administration – many of these things logically belong here. But not all of them. As the CBD evolves, its function is likely to further change from one of centralised administration to one of concentrated amenity – a district that appeals to the wider region and which services a range of appetites from recreation to dining to entertainment to shopping to learning and more. There are jobs attached to all these industries, and just because they don’t all wear business clothes, it doesn’t mean they’re not important. 

It might be time to start thinking very differently about what a ‘CBD’ really is and what will make it tick into the future.