Showing posts with label Australia census. Show all posts

Monday, October 16, 2017

A new geography of urban wealth?


US based urbanist Richard Florida - once described as an “intellectual Rockstar” – shot to fame with his 2002 book The Creative Class. He was on a global speaking tour that took in many Australian cities, arguing that the secrets to economic development lay in attracting legions of creatively motivated progressives working in new economy professions. This was best done by enhancing inner urban “hipsterness” measured by a “bohemian index” with investments in public space, recreation, culture, and various other “urban chic” accoutrements. Many city leaders rushed for the Florida gospel, applying its preaching in the hope of out-hipping competing urban centres for precious jobs in the new economy. 

But Florida has since re-canted, admitting that the focus on inner urban “cool” may have worked for the wealthy and privileged but at the same time created city wide disadvantage. His latest book The New Urban Crisis suggests an alarming wealth divide is opening up between inner urban and suburban landscapes.

“Across nearly every metro area, middle-class neighborhoods are disappearing. Our cities and suburbs are being replaced by a patchwork metropolis, in which small areas of privilege are surrounded by vast swaths of poverty and disadvantage.  The rise of a winner-take-all-urbanism, with a small group of winners and a much larger span of losers, signals a profound crisis of today’s urbanized knowledge economy that threatens our economic future and way of life,” he now says. Talk about a change of heart.

While much of this may be true for major cities in the USA (where hipster havens like San Francisco or New York are losing millennials to lower cost of living centres in flyover country) is it also true for Australian cities? Are we seeing a concentration of wealth in inner urban suburbs while suburban areas languish? Certainly, the infrastructure and policy focus in most Australian cities has, for the past 15 years, been very much on enhanced inner urban amenity. But has this been enough to draw more high-income residents to the inner city and cause professionals to abandon the suburbs?

The evidence is revealing. Here’s a quick wrap of the picture across Australia’s capitals as of the 2016 Census.

Brisbane.


The household income difference between inner urban residents of Brisbane and those of the wider metro area have widened in the 2006-2016 period. Over that ten years, inner city residents (roughly within a 5 kilometre radius) have gone from enjoying incomes that were on average 13% higher than the wider metro average to now 23% more than the metro average. In dollar terms, inner Brisbane households earn on average $357 a week more than the metro average for the city.

However, the traditional patchwork quilt of high and low income suburbs remains a dominant feature. The suburb you live in still tends to define your household wealth status – be it high or low. Brisbane’s western suburbs (Fig Tree Pocket, Pinjarra Hills, Brookfield etc) are still among the highest income earners. South eastern suburbs (Carindale, Wakerley, Rochedale) are fast catching up. There are inner suburbs on the high income list (Bardon, Paddington, Bulimba etc) but there are others (like Kelvin Grove or Herston) which are well below the city wide average.

So while it is true the inner city is gentrifying, the preference among many high income households still appears to be for traditional suburban neighborhoods, many in middle to outer urban areas.

Sydney


Sydney is different. In 2006, household incomes in the Sydney city and inner south region were roughly the same as the wider metro average. By 2016 they were only 8% more. The North Sydney-Mossman inner city region actually went from being 56% more than the metro average to 37% more by 2016, while the Eastern suburbs north region stayed roughly the same – from 37% more to 38% more ten years later.

In dollar terms however, the differences are more stark: the average North Sydney-Mossman household in 2016 was pulling in $642 a week more than the metro average; and it was $667 a week more in the Eastern suburbs North.

So inner city residents of Sydney earn a lot more than the metro average in both dollar and percentage terms but it’s been that way for some time – hardly any surprise. This is entirely consistent with Sydney’s long term role as financial and business centre for Australia, which has arguably been the case for some decades now. Research would need to look back to the 1990s or earlier to find a turning point where inner urban income disparity began to widen significantly from the metro wide average – if indeed it did (or has it been so since the 1960s?)

However, proximity to the core does not preclude a number of middle and outer suburbs from joining the high income household list. Rouse Hill to the north west or Port Hacking to the south are two of several examples. In Sydney’s case, proximity to the core appears to have a significant relationship to high income households, but this has probably been the case since long before Florida published his first book.

Melbourne.


The household income gap in inner Melbourne compared with the greater Melbourne average widened from 5% more in 2006 to 10% more in 2016. The difference was greater in the Melbourne inner east area (14% more in 2016) but this was unchanged since 2006 (when it was 15%). In dollar terms, inner Melbourne households earn $155 more than the metro wide average and this rises to $213 a week more for the smaller Melbourne inner east area.

Overall, despite a widely reported acceleration of urban density programs in inner Melbourne over the past decade, this appears to have little impact on widening income disparity. In fact, it is possible to argue that Melbourne is more equitable in terms of inner urban versus wider metro household incomes than any other capital.

Melbourne also continues to exhibit a preference among high income households for a large number of middle and outer suburban areas. Any suggestion that high income professionals in Melbourne have abandoned the burbs for the inner city is not supported by the evidence.

Adelaide.


Households in Adelaide’s inner city (essentially its CBD) earned roughly 1% less than the metro average for the city in 2016 – which was down from 11% more in 2006. However, inner urban pockets such as Burnside inner (36% more in 2016) or Prospect-Walkerville (27% more in 2016) showed more disparity - but these differences seem for the most part unchanged since 2006 (when Burnside inner was 32% higher than the metro average and Prospect-Walkerville 19%).

So suburbs immediately adjoining the inner urban core of Adelaide appear to show more income differential compared with the metro average than the core itself, and these differences – 36% more in the case of Burnside – are substantial. But like Sydney, it would seem that this has been the case for at least the period since 2006 and there is no strong evidence of a widening income gap between inner and broader metro Adelaide - where the Adelaide Hills and foothills continue to be the preferred (suburban) environment for higher income households.

Perth


The gap between inner city household incomes and the wider metro area in Perth are widening – rising from 13% more in inner Perth in 2006 to 24% more in 2016. In dollar terms, inner city Perth households are now earning on average $386 a week more than the metro average for the city. At the time of the Census (August 2016) Perth was in the midst of a downturn in economic fortunes linked to the slowing resources sector.

You could speculate whether this had greater financial impact on inner urban or middle and outer urban households but without further study, this remains a topic of conjecture. For now at least, it remains the beachside suburbs north of the city that are home to the higher income households, much as it has long been.

So, what’s this all mean?

First, the Australian evidence runs contrary to suggestions that higher income professionals are abandoning the suburbs for “cooler, inner urban hipster” markets. Indeed, middle and suburban locations are where you are just as likely to find pockets of high income earning households (with the possible exception of Sydney where wealth does some more concentrated). The same, of course also applies to low income households but the point being that proximity to the core is not yet a key determinant for most cities – at least on the evidence. Larger homes and leafier environs remain for many a more powerful lure than higher density inner urban environments. There is evidence this may be changing and the gap widening, but the pace of change is not what some boosters have suggested. The suburbs have certainly not fallen from favour and remain very much desirable in the eyes of the higher income households that many inner urban markets covet.

It’s also fair to suggest that the income and wealth disparity Florida is now alerted to in cities like San Francisco and New York is of a scale that we are yet to see in Australian cities (again with the possible exception of Sydney). The enhancement of urban cores in many Australian city centres as so far mostly been insufficient to lure legions of high income creative class workers into those cores as places to live. Some will argue by pointing to anecdotal evidence (much of it owed to gushy headlines manufactured by eager boosters) but on the whole, Australian cities have avoided the problems that Florida now warns about.

For the time being at least.

Footnote: The maps used in this story came from a handy online tool published by The Guardian. You can have your own fun via this link.


Saturday, June 17, 2017

How the future of work will reshape our cities


The growth industries and professions of the future will shape our cities in very different ways to the industries and professions that shaped our cities in the past. There are profound implications for urban planning and property, if we’re ready for them

The biggest growth industry for coming years and for the foreseeable future, the official forecasts all seem to agree on, will be in health care and social assistance. This includes professions from surgeons to GPs to nurses to child care or aged care, various therapies and counsellors, dental, and even laundry workers, cleaners and administrative support roles. Already our biggest single industry, it employs more than 1.5 million Australians. It grew by over 20% in the five years to 2015 and that rate of growth is unlikely to change going forward. Nearly half of everyone in this industry has a bachelor’s degree or some higher education qualification so they’re not all hospital cleaners – many will be skilled professionals.

This will be followed by the professional, scientific and technical services industry and very close behind that, the education and training industry. Construction, manufacturing (yes, still growing despite all attempts to kill it off) and accommodation and food services round up the top six biggest growth industries of the future.

This is important because the nature of growth industries of the future - and more particularly where they will be located - is going to reshape our cities in a very different way to the industries that grew with and shaped our cities in the past. This was highlighted in a recent report on employment in the growing region of South East Queensland, prepared by Macroplan for The Suburban Alliance.


The health care and social assistance industry is predicted by government authorities to grow more than any other industry in the years to 2041, producing around 220,000 extra jobs. But this industry has very different spatial needs to, say, the legal industry which has the highest inner city concentration of any occupation in the region. In health and social assistance, 200,000 of those 220,000 jobs will likely be in suburban business districts or otherwise scattered across suburbia. The biggest growth industry has little need or preference for clustering in the inner city.


Consider the implications for transport networks, property development and urban planning. What will it mean in terms of additional medical centres, hospitals, professional and consulting suites, new aged care and child care, and all the peripheral jobs that hang off these occupations? Where will they go? Will we see existing shopping centres morph from a largely retail focused offer to embrace a wider range of mixed uses? And if not in existing centres, what planning changes will be needed to accommodate this growth in new centres?

Our urban model, reflecting a 100 years of employment centralization, is changing to one of employment dispersal. Jobs are not moving from the city centre to the suburbs but the industries which fuel growth are changing, and with them, the patterns of employment location.

Even in the professional, scientific and technical services industry – one you would presume is largely centralized - much of that future growth (based on current spatial preferences) will occur outside the inner city. Take for example the generically titled occupation of “professional.” There were 284,300 of these in the South-East Queensland region but only 24% of them in the inner city. A further quarter were in a number of defined suburban business districts and the balance – half – elsewhere in suburbia. This is our second biggest growth industry and those patterns of employment distribution are unlikely to change meaning of the 146,000 new jobs in this industry to be created to 2041, the clear majority will likely be suburban based.

The third biggest growth industry (education) also shows little evidence of centralization – only 7% of educators are inner city workers the rest are suburban. Even of those professionals who describe their occupation as “Chief executives, general managers or legislators” delivers a surprise: there are only 21% of them in the inner city. And for clerical and administrative workers, it’s a similar picture: only 22% are inner city workers. The rest are suburbia based.

Engineers appear to have a preference for central locations with 42% of the 16,639 engineers of South East Queensland in the inner city as do the lawyers with 65% of them in the entire region to be found in the inner city. But there are only (fortunately?) just over 9,000 lawyers in the entire region so unless there’s to be an unpredicted explosion of work in the legal profession in the future it’s hard to see this occupation fueling demand for space and transport in the inner city of the future.

Fifty years ago, cities were full of clerical and administrative, managerial and professional workers, shuffling in to centralized offices in their cars or on trams, trains or buses to clock on at 9am and clock off at 5pm. The suburbs were centres of manufacturing and heavy industry, and retailing, wholesaling and transit related industries. That pattern is still there but in another fifty years’ time, our cities will have different industries generating the bulk of jobs and many of those jobs will need to be based in suburban centres to be closer to their markets or regional transport arteries.

And what are the implications for our city centres? Will they continue to evolve to embrace yet more entertainment, recreational and culture based hubs for the regions they serve, rather than largely just places of work? And how will different cities behave, given the economic drivers can be so substantially different?

There’s much more to be explored in this because the implications are profound. Sadly, much of our thinking around urban planning seems firmly rooted in traditional models which owe more to a sentimental rear vision view of urban development rather than a forward looking one.


Footnote: If you or your organization is interested in exploring what this means in more detail, or for specific regions, please just drop me an email. I’d be very interested to discuss this with you. I’ve got a useful presentation which runs through all this in a bit more detail which I’d be happy to share. You can download the entire report prepared for The Suburban Alliance here.

Tuesday, June 28, 2016

Why urbanisation is mostly a suburban phenomenon.


The world is rapidly urbanizing. The United Nations estimates that sometime around 2008, half the world’s population was urban, for the first time in human history. They estimate that by 2050 nearly two thirds of the world’s developing nation populations will be urban, while for the developed world, the figure will be a massive 86%. Australia fits this picture perfectly: some 80% of our population already lives in our major cities and half live in the three largest. But what’s not widely understood is that on both the global level and the Australian scale, this urban growth has been a suburban phenomenon.

This reality may come as a surprise to many and the cause might be in semantics. The term ‘urban’ has fallen into common use to describe higher density, inner city areas, while ‘suburban’ has typically been used to describe outlying areas of predominantly low density development (primarily housing). But when global statistics about urbanization are quoted, the meaning covers both inner and outer urban areas. Suburban is, after all, a subset of ‘urban.’

According to the MIT Center forAdvanced Urbanism: “While statistics demonstrate that the amount of the world population in metropolitan areas is rapidly increasing, rarely is it understood that the bulk of this growth occurs in the suburbanized peripheries of cities. Domestically, over 69% of all U.S. residents live in suburban areas; internationally, many other developed countries are predominately suburban, while many developing countries are rapidly suburbanizing as well… Suburbanization is a contemporary global phenomenon.”

The same is true for Australian cities. In terms of where we urbanized Aussies call home, for the vast majority it is suburbia. In Sydney for example, the proportion of people living within the prized 5 kilometre ring of the CBD is just 8%. A further 16% live between 5 and 10 kilometres from the CBD, a third live between 10 and 20 kilometres from  the CBD and 43% of people live beyond 20 kilometres from the CBD. Those proportions are broadly the same for other major capitals.  Rates of growth are similarly skewed to suburbia: despite some high rates of intense growth in inner areas, the broader metropolitan framework of our major cities continues to carry the bulk of the population growth workload.

What comes as an even greater surprise to many is that the bulk of jobs in our large metro regions are also suburban by location. The CBDs of Brisbane, Sydney and Melbourne account for 13%, 13% and 10% respectively of all jobs in their metropolitan areas. Adding in city fringe areas lifts this proportion to 19%, 15% and 14% respectively. This is an economic reality borne out by the Census but it doesn’t sit easily with much of our thinking about cities. Our perceptions and prejudices are formed by a concentration of media and planning debate on inner city areas. Impressive CBD skylines dominate news bulletins and vision of crowded commuters boarding mass transit lead us to conclude that this must be the norm for a majority of people. It isn’t.

The same is true of the United States. A recent article by Demographia’s Wendell Cox, writing in Joel Kotkin’s New Geography showed that, based on US Census Data, the CBDs of 52 major metropolitan areas contained 9.1% of jobs, and the inner rings a further 9.8% of jobs. “Early suburbs” (meaning those developed first in the history of urban growth) contained 44% of jobs while “later suburbs” and “exurbs” contained a further 37% of jobs. And in terms of jobs growth for the same 52 US metro areas in the period 2010 to 2014, CBDs accounted for 12.6% of growth, the inner ring a further 6.8% while suburban and exurban areas combined to create 80.6% of jobs growth. 

If the reality of suburbia is that it is the dominant housing and employment location for the majority of urbanites, it is also a reality that the changing economic landscape, enabled by rapid advances in technology, is going to continue to reshape both the suburban and inner urban landscape. There will always be a role for central business districts as the seats of government or as headquarters of large professional corporates, as well as centres for civic cultural investment, but the growing service sector and growth in new industries might increasingly exploit more accessible, lower cost suburban locations. There’s merit in this, as it may allow more people to live closer to their work, in more affordable locations. It may also prove cheaper from an infrastructure point of view, especially if car sharing and ride sharing and driverless technology begins to liberate us from the twin burdens of congestion and exorbitantly costly mass transit solutions designed around centralised centres of work.

This “new suburbanism” presents all manner of opportunities for economic development, productivity growth and property development. Identifying what those opportunities are and how to best capture them will require a new framework for thinking about what it means to be ‘urban’ and that thinking, I suspect, will increasingly turn to the suburban solution.

Tuesday, November 24, 2015

2016 is Census Year. But why do we bother?

Every five years Australia holds a census of its people and housing and next year it’s our turn again. The five yearly interval was introduced back in 1961 and it has over time become the essential reference point for demographers, economists, researchers, planners, governments and industry.  The last one in 2011 cost $440 million. It’s a small price to pay for such a high quality image of the reality of Australian society. So why are so many keen to ignore it?

Evidence geeks (myself included) love Census data because it’s almost impossible to refute. Myths and theories can whirl around in a drunken dance together with ideology and blind faith, but there’s nothing like a Census to bring them crashing to the floor with a sobering thud. It’s the indisputable authority on our people, housing and habits that make us Australian. On the evening of the 9th August 2016, wherever you are in Australia, as one of 24 million Australians and some 10 million dwellings, you will be counted and your demographic, economic, social, religious, education and transport profiles (to name just a few) will be taken.

And according to the Australian Bureau of Statistics “The 2016 Census will be Australia’s first Census where more than two thirds of Australia’s population (more than 15 million people) are expected to complete the Census online in August 2016. New delivery and collection procedures will make it easier to complete the Census online.” Which is going to be way more fun than an hour of Fruit Ninja, Subway Surfer or killing time on Snapchat.

Some more Census basics from the ABS Website: 

“In 2016, the ABS will:

  • Mail 13.5 million letters to households and establishments across Australia
  • Count all of Australia’s 10 million dwellings and 24 million people
  • Employ around 39,000 temporary field staff across a variety of roles, including up to 500 people to process the data
  • Scan paper forms as they arrive using industrial scanners operating 12 hours per day, 5 days per week, over 10 weeks, scanning close to 88 million pages
  • Produce and publish over 3 trillion cells of data as a result of the information collected in the Census.”

The level of detail provided by the census findings allows almost microscopic analysis of populated areas – down to groups of around 400 people (called a Statistical Area 1, or SA1). Combined with powerful GIS data mapping, the results can be displayed in a graphical way that is both intuitive and highly informative. 

But despite the best quality of data and the most advanced tools for interpreting and communicating that data, you can almost guarantee that sections of industry, media, think tanks and various lobby groups will either turn blind eyes to the findings, or find ways to contort the findings to suit their various agendas. 

Frustratingly, urban myths will persist despite the abundance of fresh, resolute data provided by the Census. Which makes you wonder why we bother with the expense and effort of gathering hard evidence only to find ourselves confounded by public policy which owes more to perception and prejudice. 

What are some of the myths that might prevail despite evidence to the contrary? Here are some nominations but we’ll have to wait until 2017 to see for sure:


  • The myth that all the jobs growth, and all the jobs, are in the inner city. The past several Census’ have stubbornly revealed that CBD and inner city shares of metro wide jobs are stuck at around 10% to 15% of the total, depending on the city. City centre jobs are growing, but so are suburban ones – and generally at least as fast if not faster. Some will ignore the relative balance between city centre and suburban market, and by only focussing on changes in the smaller city centre market, make distorted claims that appeal to kindred booster interests. Those claims get repeated without query, and the myths get a new lease of life.
  • The myth that millennials and Gen Y overwhelmingly favour apartment living in the inner city. There has been a very significant increase in the supply of new housing in the form of inner city apartments in the inter census period and there will be even more completed by August 9, 2016. The Census will reveal how much of that stock is occupied and by what types of households, and will prove an interesting reference point in the debate about the type of housing we are building, and for whom. 
  • The myth that families have turned away from the traditional suburban home. There have been numerous reports in recent years suggesting that young families have abandoned the ‘dream’ of a detached home with a backyard for the kids. I doubt this is true and suspect the Census might reveal how untrue this is. Sure, if you’re a young single or young couple with few ties and big city careers, the downtown loft is a lifestyle solution. But once children come along, or certainly by the stage they are ready for pre-school, my suspicion is that Census data will show young families still overwhelmingly choose the detached housing form in a suburban location. This is not to suggest there won’t be an increase in families being raised in apartment style living but I can’t see the scale of social change being predicted by some commentators being borne out by the evidence.
  • The myth that the traditional family model is dying. I know it’s de rigueur to talk about the growth of single person households, gay and lesbian couples (“not that there’s anything wrong with that”) increasing divorce rates and so on, but the Census is a reality check on what can become a runaway debate.  Unless I’m terribly mistaken, the idea of mating and producing children hasn’t suddenly gone out of fashion for the overwhelming majority of Australians. Much to the frustration of some social campaigners, I suspect the Census will reveal a stubbornly conservative majority still prevails. 
  • The myth that retirees are generally all wealthy boomers with money to burn. I know it’s an appealing thought, but I suspect the income data sets for seniors and retirees will paint a sobering picture of household incomes for this cohort. Assets are another thing of course and the Census doesn’t ask about assets like the value of the family home. But still, it’s cash flow that pays the grocery and other bills and most seniors, I suspect, will be shown to be on lower incomes than we’d like to think.

Why bother with the Census? Some will ignore it and others will twist its findings into all manner of statistical contortions to prove a theory they’ve decided to believe in, no matter what. But that doesn’t detract from the fact that it’s a terrific investment in the truth of what makes us tick. Bring on August 2016!

Tuesday, October 13, 2015

Old, poor and lonely: the other side of the ageing story

Much is being made of opportunities for retirement living and aged care due to our ageing population. For those who retire with a healthy balance sheet there are increasing choices within a fast evolving ‘for profit’ industry. But the reality for a majority will be ongoing dependence on the aged pension and insufficient government or non-profit places to accommodate them.

The basics of our ageing population are easy enough to understand. First, there will be more of them – with Australians aged 65 plus the fastest growing cohort in coming years, rising from 14% of the population now to around one in five Australians by 2033. In terms of actual numbers, the current estimate of around 3.5 million Australians aged 65 plus will rise to around 6.3 million in the next 20 years – an increase of around 2.8 million people. I will be one of them.

For the aged care and retirement living industry, this is a future demand profile virtually immune from market cycles. You can’t stop people aging, and as we live longer, there will be more people ageing than ever before. Life expectancy in 1970 was 70 years of age. It’s now 82, and still climbing. If you are currently aged 65, you can (on average) expect to live another 19 years for males, and 22 years for females, because ironically the longer you live the greater your life expectancy becomes.

In response, sections of the retirement living and aged care industry are transforming rapidly. What was once a cottage industry run mostly by charitable, religious or non-profit groups, is rapidly evolving into a very professional industry run by private or publicly listed businesses, looking for greenfield expansion, acquisition or redevelopment opportunities to grow portfolios and improve operational efficiencies. Many of these businesses are well positioned for ongoing growth in scale and profits and will be cheered on as market darlings by investors and an increasing number of people reliant on their growth for work. Including me, hopefully.

At the same time it is easy to lose sight of a more sobering market reality. Expansion in the aged care and retirement living industry is being led by businesses who are catering in the main for the upscale end of the market. In other words, old people with money. A significant proportion (and perhaps a majority) of old people won’t have the funds needed to enter private retirement living or aged care, or if they do, their funds might be depleted because they live longer than they budgeted for. Don’t get squeamish on me at this point, because ageing is all about economics and budgets.

So here are some financial angles on the ageing demographic which reveal a worrying future policy landscape for those not at the premium end of the retiree market.

Today, roughly one in four people aged 65 and over are either renting their own home, or still paying off a mortgage. The proportion who own their own home outright is falling, and based on falling rates of home ownership amongst Australia’s current generation of 30 somethings, the proportion who own their own home by say 2050 will be significantly less.

Then there is superannuation. The average current super balance of someone aged 60 plus and not yet retired is just $95,000. The proportion of people aged 65 and over who have no superannuation at all is around 65%. Yes, this is changing as more superannuants retire, but superannuation balances are not what you’d think. The average superannuation balance of someone aged between 70 and 74 – the average age of entry to a retirement village – is just $102,000 but this plummets to just $38,000 for the 75 to 79 age group. Or put another way, the number of Australians aged 50 and over with a super balance of more than $500,000 is just 5%.

The biggest asset most current or future retirees will have is their own home, but remember that one in four are either renting or still paying off a mortgage. There are 13.5% of Australians aged 65 plus who are renting their own home. For those who own their own home, the average value of this (in 2012) was around $500,000.

In terms of incomes, two thirds of people currently aged 65 plus have a weekly income of less than $400. This is heavily influenced by the age pension, which one in four current retirees receive at the full rate (being $430 a week). A further quarter receive a part pension, while only a third are self-funded. Remarkably some 18% of retirement age Australians are still employed, but whether this is of necessity or by choice I don’t know.

So the economic picture here is one where a significant proportion of Australian retirees, and by definition also those who will need aged care, generally have insufficient assets, savings or financial means to fund the lengthening number of years where they won’t have an income and where their costs of care and accommodation will increase.

This is a market segment no one seems to be talking about. I presume there is an assumption that government or religious/charity/not for profit groups will continue to cater for this market. But the numbers are such that many non-profit groups won’t have the financial resources to meet this growing demand as many are struggling with financing existing operations, let alone expansion. Which leaves the government, meaning the taxpayer, and the reality here is that there will be increasingly fewer taxpayers of working age relative to the number of aged dependents, meaning higher taxes. Sorry hipster generation, it’s looking pretty ordinary for you.

So what’s going to give? Will we see a return to multi-generational housing where grandparents, parents and children live under the same roof? There will no doubt be some of this, but it’s hard to see how our social mores will change to the degree needed to relieve pressure on demand. What’s really needed is an affordable housing solution for retirees and Australians in need of aged care, for whom the commercial part of the market will remain beyond reach.

Given our wholesale failure to address housing affordability problems for working age Australians and young families, it’s difficult to be positive about any meaningful solutions being found for the other end of the age spectrum. Keep that in mind when you next look at those marketing images of healthy looking silver haired retirees with perfect skin, wearing pastel coloured cashmere jumpers and big smiles (and their own teeth), holding hands as they walk on the beach… they are far from reality for the majority.


Monday, April 22, 2013

The demography of employment part 3: heading for a new class divide?


This third instalment of ‘The Demography of Employment’ looks at the different income profiles of city centre and suburban workers in Brisbane, Sydney and Melbourne. The results show some marked disparities based on geography, with the average CBD worker earning a quarter to a third more their average suburban counterpart. The top ten income areas city wide are nearly all inner city areas, and these workers earn more than double the average of the bottom 10 areas. Given that for every inner city worker there are around 7 or 8 suburban workers, the income divide between suburban worker and city worker becomes more stark.

The data referred to in this article has been extracted from Census data and prepared by the team at Urban Economics – an urban research company based in Brisbane. There are plenty of spread sheets to back up the statistics that follow so if you have further interest in this subject, I suggest you give them a call on (07) 3839 1400 or email Kerriane at kbonwick@urbaneconomics.com.au

In each of the three largest capital cities in Australia, the top ten income earning areas are mainly centred around the CBDs. Workers in central business districts areas earn on average between $80,000 and $90,000 each per annum. For working couples where both have city jobs, that’s a healthy household income of around $160,000 to $180,000 per annum.

Their suburban counterparts don’t fare so well. Average non CBD incomes are around $50,000 per annum. A working couple, on average, might bring home $100,000 per annum, a substantial $60,000 or even $80,000 less than their CBD worker counterpart. (These are just averages of course and good for order of magnitude comparisons only. It’s like the story of the economist who, with his feet in a bucket of ice and his head in a hot oven proclaimed ‘on average, I feel fine!’).

There are good reasons for this. CBD workers are likely to have higher standards of education and more saleable skills, working for businesses which pay a premium for talent in white collar industries such as finance, property and investment. Suburban employment typically leans more to retail and wholesale trades, and more blue collar industries where higher incomes are harder to earn. For areas in the suburban economy which are highly reliant on retail employment, for example, average incomes fall to around the mid to high $30,000s. Across all of our major metropolitan areas, there are many more people and families on these lower income levels than there are families where income earners enjoy inner city jobs and the pay packets that come with them.

Brisbane.

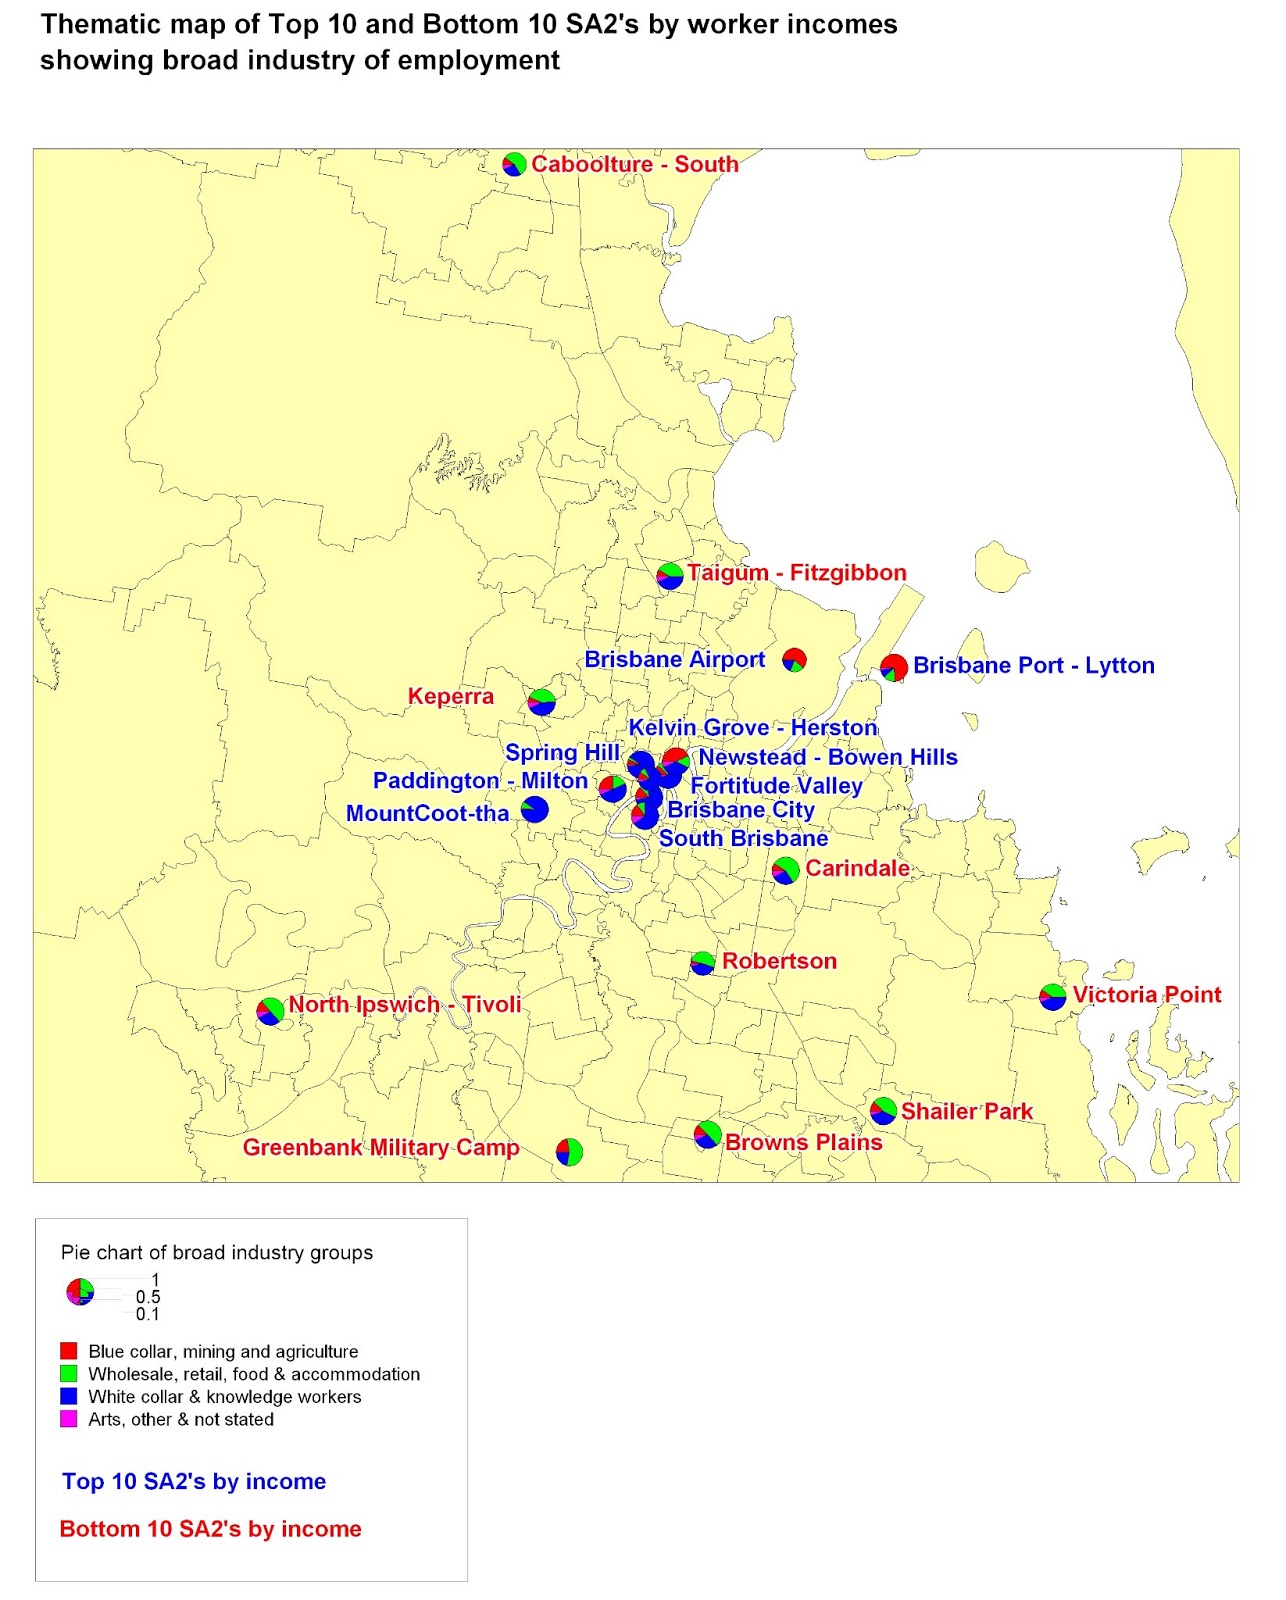
Highest average incomes in Brisbane are for jobs in the CBD, at $81,500 per annum. Second is inner city Newstead-Bowen Hills ($77,330) and third, Spring Hill ($75,880). But where the CBD and Spring Hill jobs are white collar knowledge workers and public servants (75%), there are only 35% of these types of workers in Bowen Hills, where 43% of jobs are blue collar. Adding to evidence that all high incomes aren’t always white collar are the Brisbane-Port Lytton area and the Brisbane Airport area, which are the 6th and 8th highest income areas in Brisbane with 74% and 62% of jobs classed as blue collar. But these are exceptions to the rule, with all other top ten income places taken by inner city areas.

Conversely, the bottom ten are nearly all outer suburban, led by Greenbank, then Caboolture, Taigum-Fitzgibbon, Robertson, Keperra, Victoria Point, North Ipswich, Carindale, Browns Plans and Shailer Park (incomes ranging from $33,710 to $37,770). The types of jobs are weighted more heavily to retail and wholesale trade, food and accommodation (roughly half of all jobs in these areas). Of interest is that even Taigum-Fitzgibbon and Keperra show a high percentage of white collar jobs for suburban areas (43%) but are still in the bottom ten. A white collar job it seems is in itself no guarantee of a good income.

Across the city, the average suburban job brings home $47,994 per annum while the average inner city job brings home 25% more at just over $60,000.


Sydney

North Sydney comes first for incomes across the Sydney region, at $93,410 per annum average. North and East Ryde are next ($89,570), followed by the CBD and Rocks ($89,210). At fourth and fifth place are the suburban employment centres Macquarie Park and West Pennant Hills. The latter has 80% of jobs in white collar positions but Macquarie Park is more evenly split between retail, wholesale and hospitality (29%) and white collar (54%) jobs. Further intensive development planned in this area will soon change these ratios.

Port and airport areas also feature in the top 10, with Port Botany ($75,560pa) and Banksmeadow ($75,210pa) showing that having 65% and 66% of jobs in blue collar roles is no barrier to a top 10 average income.

Sydney’s lowest income areas are around Bateau Bay, Roselands, Gorokan, Budgewoi, Casula, Cambridge Park, Umina, St Albans, Wyoming and Cabrammatta West, where average incomes range from $37,050 to $39,820 per annum. Here there are higher proportions of jobs in retail and wholesale trade (typically around 40% to 50%) but there are also reasonably high proportions of white collar jobs (mid-30%s to mid-40%s). Once again the evidence seems to say that a white collar job is no guarantee of a high income.
Across the Sydney metropolitan area, the average income of inner city workers was around $66,929 per annum and for their suburban counterparts, substantially less at $51,715 per annum.


Melbourne

Melbourne’s top ten income areas were almost all exclusively inner city, led by the Docklands ($87,300) a good way ahead of the CBD ($81,640). Then follow South Yarra, Southbank, Albert Park, East Melbourne, South Melbourne, West Melbourne and Abbotsford (the latter on an average of $70,250). Glen Iris – East is the only non-inner city area to make Melbourne’s top 10, coming in at number six ($76,300). All are largely white collar locations, with the exception on West Melbourne where 64% of jobs are blue collar and only 6% classified as white collar.

The lowest income areas across Melbourne are all outer areas, led by Taylors Lakes ($34,230) then Hoppers Crossing, Maribyrnong, Chirnside Park, Altona, Melton, Mill Park, Frankston, Meadow Heights and Mount Dandenong ($38,290). Altona Meadows and Frankston North show relatively high proportions of white collar jobs (46% each) which again is evidence that this is no guarantee of an area reporting higher average incomes.
Across the Melbourne metropolitan area, the average suburban worker earns $48,188 per annum, while their inner city counterpart brings home 24% more on $59,758 per annum.


Implications.

Earlier in this series we showed that suburban jobs outnumber city and inner city jobs by around 7 or 8 to one. We also know from the census results that inner city workers aren’t just in the minority by nature of location, but they are also in the minority by way of income. In both cases, it’s a case of being in a privileged minority: inner city workers earn on average a good deal more than their numerically superior suburban counterparts.

These averages aren’t always due simply to the nature of employment. Some suburban areas with relatively high levels of white collar employment are still featuring at the lower end of the income scale. Conversely, some areas with high proportions of blue collar employment also appear at the higher end of the income scale. (Mining, a non-urban industry is beyond the scope of this study but for the curious, the top 10 Australia wide areas for income are all mining regions, with incomes above $100,000 per annum).  So there are some grounds to suggest that location, as much as the nature of industry, has a significant bearing on income.

The evidence clearly shows that inner city areas have higher incomes. In many cases, considerably higher than suburban or outer suburban jobs. Our inner city areas are places of privilege in terms of the jobs they provide but also in terms of the riches of social infrastructure funded by the taxpayer. Heavily subsidised public transport networks are mainly designed to get inner city workers to and from their higher paying jobs. Taxpayer funded cultural, recreational and social infrastructure is concentrated in inner city areas, arguably where it is of more benefit (it is certainly more accessible) to inner city workers than residents of middle or outer suburban areas with suburban employment.

With so much intense discussion about urban growth and development typically focussed on what happens within a 5 kilometre radius of the CBD, it is fair to ask if this intense focus has diverted attention away from the needs of the majority of lower income (suburban) workers, to the benefit of the numerically smaller but considerably richer, inner city workers. The latter, based on the evidence, have a greater capacity to pay for the infrastructure they enjoy than the suburban worker and taxpayer.

This poses a challenge for policy makers and opinion leaders, many of whom are not only CBD or inner city workers themselves, but also residents of the inner city or near city areas. Living, working, shopping and pursuing high-end leisure pursuits in this privileged environment could lead to distorted views of the broader metropolitan economy. The CBDs and near city areas are seats of government and the headquarters of major companies. They are also typically where decision makers and opinion leaders in corporate life, public policy, the media, and industry groups live and circulate. It is easy to suspect that a good proportion of them don’t move much beyond these geographic confines.

I was reminded of this a couple of months ago when Prime Minister Julia Gillard decided to descend on the people of Rooty Hill, in Sydney’s west, hunting for votes. Following her went the Sunrise Show, the Today Show, and much of the press gallery. The footage I saw of them traipsing around Rooty Hill looking for ‘the real people’ reminded me of travellers in a strange land, encountering cultures and people quite alien to them. The people of Rooty Hill and western Sydney may well have breathed a sigh of relief when the circus left town a few days later. (Ironically, and in a classic display of how sad public policy making has become, the Prime Minister made some grand promises about an additional $1bn funding for a major highway upgrade to better connect the west to the CBD. This was despite the evidence which shows - though mustn’t have been consulted - that only a very small proportion of the people living there actually work in the Sydney CBD or its surrounds. The presumption seemed to be that Rooty Hill’s salvation lay in a better connection to the CBD. Asking the people of Sydney’s west what they really want may have revealed something else altogether).

The point here is that the income divide between city centre and suburban economies poses a challenge for policy makers. High income elites who work, live and circulate largely within a defined radius of the CBD could, unchecked, tend to dictate urban policy for the entire city, based on their limited perspective. We’ve seen elements of this surface in the disdain with which suburban ‘McMansions’ have been derided, or how the supposed ‘love affair’ suburban workers have with the private vehicle has been attacked.

It’s a fair question to ask whether the significant investments in inner city social infrastructure through urban renewal schemes, cycle ways, river and harbour side pedestrian walks, bicycle schemes, parks and gardens, cultural facilities and the rest have been balanced with equal emphasis on similar amenities for suburban employment centres.  

These inner city investments have largely relied on public policy support and taxpayer funds, but they have also leveraged private capital which has had the confidence to further invest in this environment. If a similar partnership could attract more private capital investment into suburban employment  areas, it could lead us in the direction of more significant economic benefit city wide, as opposed to concentrated benefit in the CBDs and inner city areas.

Next: transport and employment.

Thursday, June 28, 2012

Modern families: fact from fiction

I sometimes struggle with our willingness to look straight through evidence to see only what we want to see, or what we believe we should be seeing. Some recent interpretations of the Australian census and conclusions about housing form and consumer choice regrettably fall into this category.

Early results from the Australian census may have disappointed some boosters who have actively promoted the view that the typical family household is a thing of the past. The argument has had many forms but usually includes one or more of the following: that single person households are the fastest growing household type; that lifestyle choices mean that more people want to live closer to city centres; that the suburban housing block is an environmental calamity and is no longer even suited to what households want; that high density, multi-level housing with high reliance on public transport is a preferred housing model for the ‘new’ generation of family types. And so it goes.

Sadly for the promoters of rapid social change, the census reveals that the facts aren’t on their side. Indeed, in terms of housing form and family type, nothing much has really changed. There have been movements at the margin and movements in both directions, but nothing I would interpret as conclusive evidence of fundamental social change.

Housing form

Across Australia, 73.8% of us live in a detached house. In the last census, it was 74.3%. Hardly a seismic shift. In 2011, 14.6% of us lived in apartments compared to 14.7% five years earlier. Townhouses account for 9.9% of households versus 9.3%.  Don’t hold the front page, nothing much has changed.

There are regional differences. In Sydney, detached housing is at 58.9% from 60.9% while apartments represent 27.6% of households against 26.4% five years earlier. This higher proportion in apartments comes as little surprise given the highly restrictive planning policies of NSW in that period and prior (which included a virtual prohibition on suburban expansion), combined with the long established tendency of Sydney to accommodate more people in apartments than other capitals. But for all the hype about Bob Carr’s ‘brawl against sprawl’ and subsequent planning regimes, the actual change in housing has been minimal. (Instead, what happened is that the industry stopped supplying much of either).

In Melbourne by contrast, detached housing represents 71.1% of housing from 71.6% five years earlier. Apartments are 16.6% versus 16.4%. Melbourne, and Victoria generally, has had a less deterministic approach to planning whereby detached suburban expansion hasn’t been as vigorously opposed, so the higher dominance of the detached house is no surprise. But it also shows little change over recent times, which doesn’t support the view that a majority of consumers would prefer higher density over lower.

In Brisbane, detached housing is at 77.6% versus 78.7% five years earlier, which is a very small change and also one of the highest proportions of households in detached housing in the country. Once again, the evidence isn’t pointing to massive social change. It isn’t even pointing to modest change.

Family type.

Also regrettable for the promoters of widespread social change has been the fact that family types have remained largely unchanged. There are 43% of people living as a couple with children (it was 43.3% five years earlier) and there are 39.5% living as couples without children.  Remember also that ‘couples without children’ includes couples in the pre-family formation stage (young, and starting out in life in the main) and also ‘empty nesters’ (parents whose children have left the family home). A further 16% are single parent families. 

The Census this time also went into some detail about same sex couples. But set aside the media and political hype and the facts show that the proportion of same sex couples across the country is 0.7%. There’s been a lot of media comment and public policy attention recently about that 0.7%

The inevitable conclusion from this evidence is simply that the overwhelming majority of people in Australia remain families who either have children, who plan to have children, or who have had children who have left home, and that this proportion hasn’t changed to anywhere near the extent promoters of social change might have wished.

This also has implications for housing choice and style. There will be a market for higher density, inner city housing but our policy makers need to keep in mind that the detached home remains the overwhelming preference for families as a place to raise children. That also includes couples planning to raise children (not all of whom live in apartments until the first child comes along – many prefer to plan ahead) and it also includes couples with children who have left home but for whom a third or fourth bedroom is needed for grandparent child minding or children returning to the family home.

However, the evidence hasn’t stopped some sections of the media or social commentators from reaching entirely different conclusions. “Up not out for housing” declared one writer who wrote: “Australia is increasingly favouring higher density living, according to the 2011 census.” Really? Based on the same evidence above? You’d be seriously pushed to draw that conclusion. Add to this that supply side policies have restricted the choice of detached housing in preference to the promotion of higher density, which means that increasingly housing choice has been restricted, and what there is of it, much more expensive. To conclude anything about ‘favouring’ one type of housing or another, without assessing the supply side policy constraints which limit choice, is a bit like saying more people prefer mangoes in summer than in winter. Duh.

The Grattan Institute is another that seems committed to turning the evidence on its side to support pre-determined points of view. In this opinion piece, Grattan Institute cities program fellow Peter Mares concluded that: “that despite paying significantly more to put a roof over their head than they were five years ago, many are not ending up in the kind of housing that best matches their preferences.”  Describing the “popular view that we are wedded to the suburban block” as a mismatch, the conclusion is that ‘we’ (being, I presume, the unelected policy makers)  need to have “ a serious, if difficult, conversation about what type of housing we should build and where it should be built.”

Well, that would be difficult if it means imposing a form of housing on a population that might prefer to make its own choices about what type of housing it ‘should’ have and where they ‘should’ be living. 

These aren’t the only examples and as more Census data becomes available, plenty more commentators will seek to extrapolate minor changes at the margin into claims this represents evidence of fundamental social change. It doesn’t and we can only hope our policy makers know the difference between evidence and a sitcom.